
Housing markets are not just geographically separated, they are socially stratified too (in combination the two generate what is termed, “housing market segmentation”). Properties in a region can differ radically in price (e.g., range between $20,000 and $1,000,000 per acre). Moreover, the buyer base and housing availability for that particular base can change from one month to the next, making it tough to determine when to buy or sell. The family type matters as well; for example, families with school-aged kids tend to prefer homes with sizeable yards in “good” school districts. Many singles and retirees prefer condos in low-tax neighborhoods, wanting neither to pay for better quality schools nor to care for the grounds around their homes. These different types of home buyers have different times of year that they prefer to move in and out, without respect to housing availability.
So, the takeaway from the above is that housing markets are complex. They also are, of course, important to the economy; after all, housing (or more generally “shelter”) is inevitably the most expensive item in most households’ consumption baskets. People also make major purchases in the wake of arriving at a new home. They typically buy new furniture, appliances, carpeting, and fixtures, for example. This activity engages more local workers and service providers. That is, subsequent to moves, much economic activity is engaged locally; thus, the volume of housing market transfers is a well-known leading indicator of local economic development.
Unlike other economic indicators, however, housing market indicators are driven by a relative minority of market participants. Only households that move make their mark. Movers buy and sell existing homes, purchase new homes, and, with landlords, largely establish prevailing home rental rates. Most are fresh arrivals from some other housing market, perhaps one in another state. Nationwide, only about 20% of households change their residential locations each year. Surprisingly, about half of this 20% move again the following year. In essence, the small volume of transfers and unusual stratification of housing markets can make housing indicators difficult to interpret reliably, even in the best of times. This piece is written at what is believed to be the peak of the omicron variant of the COVID-19 pandemic.
For those who can buy, housing is typically a major (if not “the foremost”) lifetime financial investment. In this regard, higher-than-average interest and inflation rates can affect the volume of home sales by enhancing the apparent volatility of local housing prices. The same goes for the vacillations in the stock market and labor market. Potential homeowners are more apt to purchase when they perceive their household income to be solid and stable for the foreseeable future. They are less apt to buy when yields from other potential investments are apparently greater and more stable than those from real estate.
So, given the above, what is the status of housing markets nationally? Existing-home sales in 2021 undoubtedly gave their strongest showing since 2006 with low mortgage-interest rates and a robust job market for middle-to high-income households, driving demand upward. A desire for more space for telecommuting gave an extra boost to demand. Economists and real-estate agents seem to agree that housing demand is likely to stay strong again this year.[1]
The supply of homes for sale dropped to a record low in January 2021 and stayed well below normal all year.[2] As a result of this and the rising demand pressures, home prices rose at double-digit pace almost everywhere in the U.S. Apartment demand nationwide helped keep rents at almost the same pace, as they rose by an average of about 11%.[3]
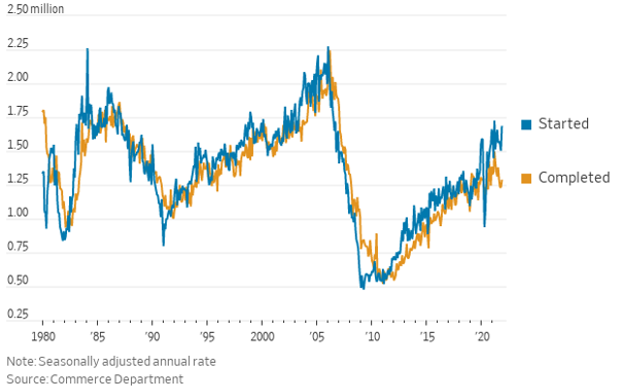
Rises in home prices and rents in New Jersey’s housing markets should be even stronger over the coming year due to its proximity to both New York City and Philadelphia. But induced by the likelihood that the Federal Reserve Board will slowly crank up short-term interest rates as 2022 progresses, rising mortgage rates are likely to slow the increase.[4] At least for the next few months, however, any interest-rate rises are likely to be countered by a peculiar aspect of the pandemic that started to show in housing markets toward the middle of 2020—a widening gap between housing starts and completions (See Figure 1). Completions lagged starts by over 400,000 units, a phenomenon not experienced in the U.S. since before 1980. Supply-chain backlogs were the apparent cause, disrupting construction efforts, limiting home-buyer choices, and forcing some owners to move into unfinished homes. Pandemic-related factory closures, transportation delays and port-capacity limits could further stymie the flow of many goods and materials critical for home building, including heating and air conditioning units, windows, garage-door apparatus, major appliances, and paint.
Figure 1: Nationwide Housing Starts versus Completions, 1980-2021
The pandemic has been hardest on lower-income households, and the housing market has been no exception. Not only has the pandemic disabled their ability to move, but it has diminished their capacity to keep the homes they had hoped to own. The “good news” is that much of the U.S. has been subject to a foreclosure moratorium starting March 19, 2020. The “bad news” is that, in New Jersey the moratorium ended on November 15, 2021. Families did not get removed from their homes by their sheriff that day, but any properties already sold almost certainly got notices of eviction that day. The end date of the moratorium varied nationwide, such that 19,479 property foreclosures got filed in November 2021—which is up 94% from a year prior.[5] Cumulatively through November 2021, one in every 7,055 housing units nationwide had a foreclosure filing attached to it.[6] Interestingly, however, the nationwide rise in foreclosures declined substantially from October. That is, the efforts of the government and mortgage servicing appear to be preventing many unnecessary pandemic-related foreclosures.
In a follow up to this piece, I will examine housing market data in New Jersey in more detail. Above, I give some insight about what to expect from that follow-up. Generally, related state trends exaggerate those nationwide due to the New Jersey’s proximity to two of the nation’s largest metropolitan areas—one of which embraces some of the highest property prices in the nation. So, expect that the prospect of telecommuting combined with a surge of millennials forming families are pushing demand beyond national observations. Moreover, given New Jersey residents’ concern for school quality, much of the surge is likely experienced in municipalities of “good” school districts. There, home prices are undoubtedly rising most and, even in much of the state, at rates faster than the national average. Unfortunately, while New Jersey may be one of the richest states in the nation, it also has an inordinately large population engaged in industries that have been most deleteriously affected by the pandemic—entertainment, transportation, and dining establishments. And, during the pandemic, workers in these industries, many of whom were already in a vulnerable economic position, are living even closer to the edge.
References:
[1] This is because many homes continue to sell above listing price and do not remain on the market as long as usual. The typical home sold in November was on the market for 18 days (See, Yun, Lawrence, Jessica Lautz, Gay D. Corporation, & Meredith Dunn. (2021). 2022 Housing Market Hidden Gems. National Association of Realtors. Available online in January 2022 at https://cdn.nar.realtor/sites/default/files/documents/2022-housing-market-hidden-gems-12-17-2021.pdf).
[2] The inventory of existing homes for sale and new single-family homes were both 12% below 2020 levels (Ibid).
[3] The median existing-home sales price rose to a national maximum of 23.6% in May 2021. But by October 2021, its appreciation has slowed to 13.1%. The median sales price of new single-family homes increased 17.5% year-over-year in October. (Ibid.)
[4] See Friedmann, Nicole, Orla McCaffrey, & Sam Goldfarb. (2022). “Mortgage Rates Hit Highest Levels Since Spring 2020,” The Wall Street Journal, January 5. Available online in January 2022 at https://www.wsj.com/articles/mortgage-rates-hit-highest-levels-since-spring-2020-11641513773
[5] See ATTOM Staff. (2021). “November 2021 U.S. Foreclosure Activity Declines Slightly from Last Month but Still on The Rise from a Year Ago,” ATTOM™, December 9. Available online in January 2022 https://www.attomdata.com/news/market-trends/foreclosures/attom-november-2021-u-s-foreclosure-market-report/
[6] Ibid.