
Not all bike lanes are created equal. New Jersey is trying to encourage bicycling as a main form of transportation by enhancing existing ways and expanding bike lanes. But only about 0.3% of New Jersey residents bike to work.[1] This contrasts with nationwide commuting behavior in countries like the Netherlands in which 32.4% of work trips are taken by bike alone.[2] A prime reason is the lack of safety precautions implemented in the United States when ways for biking and walking transportation are designed. The count of bicycle fatalities in 2021 was higher than it has been since 1989.[3] Efficient and safe bike lanes should be an important policy concern as the state invests in such infrastructure.
Compared to almost all other forms of transportation, cycling yields benefits in various realms, including health, and climate change. From a health perspective, “60-80% of the world’s population does not meet the (activity) recommendations required to induce health benefits.”[4] Promoting cycling can counter this. Increased activity improves life expectancy.[5] Moreover, cycling can help tackle climate change by keeping people out of carbon-emitting cars.[6]
Bike lanes, in particular, are important given the rise in fatal traffic crashes in New Jersey. There has been a 15.5% uptick in car crash fatalities over the past year:[7] As many as 53.7% of the fatalities were vehicle drivers, 31.6% of victims were pedestrians, 11.7% of victims were vehicle passengers, and 3.0% of victims were “pedacyclists.”[8]
Chart 1: Victim Classification of Fatal Crashes in New Jersey, 2021
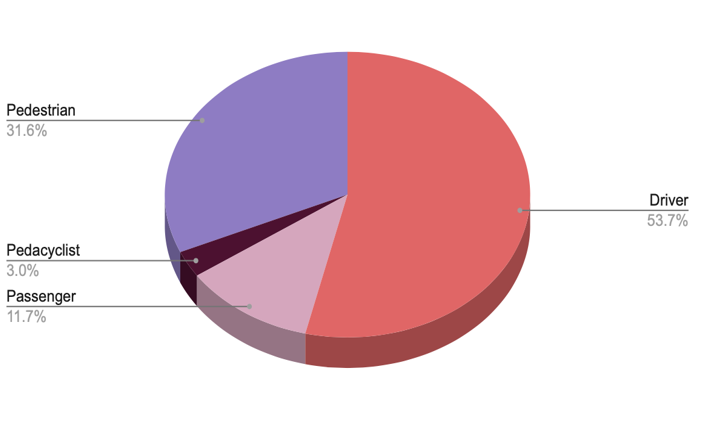
Source: Fatal Accident Investigation Unit, Year-to-Date-Statewide Fatal Crash Statistics, 2021
Access to cycling is important in New Jersey, especially for teens and the state’s disadvantaged populations.[9] In essence, New Jersey’s lower-income individuals benefit from enhanced and efficient bike lanes.
Despite the heightened attention from state and local governments to cycling lanes, more improvements are needed. Most bike lanes are marked, such that bicycles share streets with automobiles.[10] This shared system is uninviting to both cyclists and motorists alike. Typically in New Jersey, the line of separation between the bicycle and motor vehicle lanes is at best merely a painted separation (see Figure 1).
The NJ Department of Transportation has found that 70% of New Jerseyans do not use bicycles regularly because they perceive motorists as incautious around bicyclists.[11] Probing further, this same source cites the lack of bike lanes and heavy traffic as the prime underlying reasons. Both underline the importance of proper bicycle lanes. It also notes that 82% of New Jersey residents would be comfortable with a separated bicycle lane, as opposed to the standard pavement-marked bicycle lane. Thus, upgrading current and future bike lanes to a higher standard would likely improve bicycle use substantially in New Jersey.
Figure 1: New Jersey Pavement Marked Bike Lane, Visualized
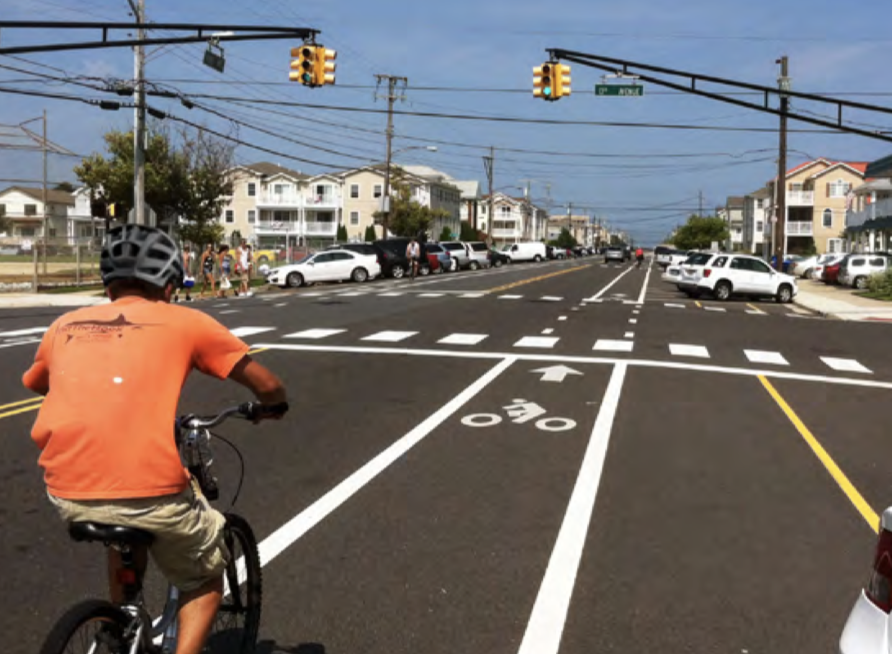
Source: NJ Department of Transportation (2016, p. 19)
Some “lightly separated” bicycle lanes provide more buffer space than others (see Figure 2). To motivate bicycle use, New Jersey can modify the design of bicycle lanes. This would encourage bicycle use and reduce both death and injury among cyclists from motor vehicles.[12] Figure 3 shows what protected bike lanes can look like. Protected bike lanes typically provide a substantial rail-like barrier, often composed of trees, plants, metal rails, and more. Injuries in protected bike lanes are less frequent and milder, compared to those that arise in unprotected bike lanes.[13]
Figure 2: Lightly Separated Bike Lanes
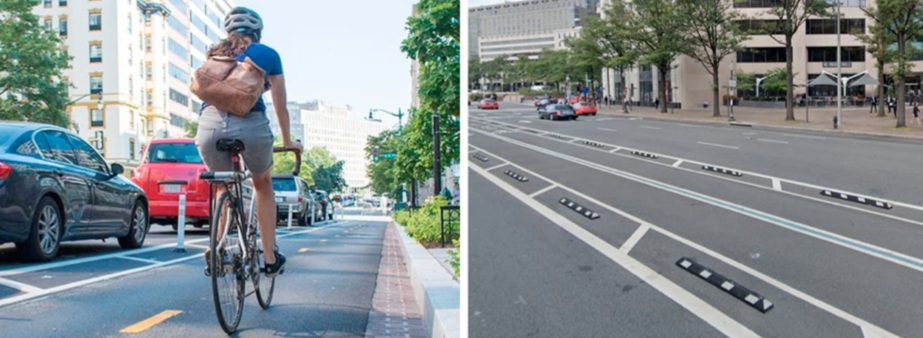
Source: Cicchino et al. (2020, p. 4)
Figure 3: Protected Bike Lanes
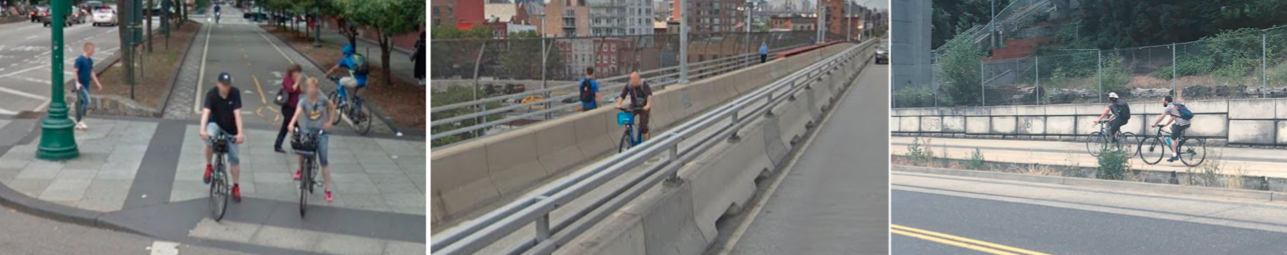
Source: Cicchino et al. (2020, p. 4)
Despite being beneficial, protected bike lanes do have some limitations. Protected bike lanes are relatively expensive; they can cost anywhere from $133,170 to $536,860 per mile.[14] This is largely because the main barrier to protected lanes is lack of road space. Maintenance costs are also nonnegligible. Moreover, even well-protected bike lanes pose some degree of safety risk to cyclists. Some drivers fail to note intersections between protected bike lanes and roadways. A great start would be enhancing signage and enabling flashing crosswalks, which can be achieved by fully embracing New Jersey’s Complete Streets policy.[15]
References:
[1] NJ Department of Transportation. (2016, November). New Jersey Bicycle and Pedestrian Master Plan. NJ.gov. Retrieved December 5, 2021, from https://www.state.nj.us/transportation/commuter/bike/pdf/bikepedmasterplan2016.pdf
[2] Stroope, J. (2021). Active transportation and social capital: The association between walking or biking for transportation and community participation. Preventative Medicine, 150(106666), 1-8. https://doi.org/10.1016/j.ypmed.2021.106666
[3] Burns, P. K. (2021) ‘This is a crisis’: Fatal crashes involving cyclists and pedestrians in N.J. at highest number since 1989,” WHYY.com, December 17. Available online in December 2021 at https://whyy.org/articles/this-is-a-crisis-fatal-crashes-involving-cyclists-and-pedestrians-in-n-j-at-highest-number-since-1989/
[4] de Hartog, J., Boogaard, H., Nijland, H., & Hoek, G. (2010). Do the Health Benefits of Cycling Outweigh the Risks? Environmental Health Perspectives, 118(8), p. 1112. http://www.jstor.org/stable/27822995
[5] de Hartog, J., Boogaard, H., Nijland, H., & Hoek, G. (2010). Do the Health Benefits of Cycling Outweigh the Risks? Environmental Health Perspectives, 118(8), 1108-1116. http://www.jstor.org/stable/27822995
[6] Abel, S., Hanzlik, M., Kraft, K., Simon, H., Isidro, C., & Mennesson, M. (2019). Walking and Biking Perspectives on Active and Sustainable Transportation. Institute of Transportation Engineers. ITE Journal, 89(5), 29-34.
[7] NJSP Fatal Accident Investigation Unit. (2021, December 5). Year to Date – Statewide Fatal Crash Statistics. New Jersey State Police. Retrieved December 5, 2021, from https://www.njsp.org/info/fatalacc/pdf/swfcs2.pdf
[8] Ibid.
[9] See fn 1.
[10] Ibid.
[11] Ibid.
[12] Cicchino, J. B., McCarthy, M. L., Newgard, C. D., Wall, S. P., DiMaggio, C. L., Kullie, P. E., Arnold, B. N., & Zuby, D. S. (2020). Not all protected bike lanes are the same: Infrastructure and risk of cyclist collisions and falls leading to emergency department visits in three U.S. cities. Accident Analysis and Prevention, 141, 1-17. https://doi.org/10.1016/j.aap.2020.105490
[13] Ibid.
[14] Wilson, K. (2020, July 29). Protected Bike Lanes that Any City Can Afford. Streetsblog USA. Retrieved December 5, 2021, from https://usa.streetsblog.org/2020/07/29/meet-the-protected-bike-lane-that-any-city-can-afford-to-build/
[15] See, e.g., “Complete Streets in New Jersey” https://www.saferoutesnj.org/complete-streets-in-new-jersey/