
The impact of the pandemic on poverty and inequality continues to be studied at a global and national scale.[1],[2] Although the U.S. Census data have yet to reflect the full extent of the pandemic on poverty, numbers are expected to rise [3] due to an economic slowdown that has disproportionately affected the most vulnerable communities.[4] Furthermore, recent rises in costs of basic necessities have exacerbated burdens on lower-income households.
As prices rise and the COVID-19 federal relief measures phase out, each state must determine how it will address the needs of residents who are struggling financially. In New Jersey, where 9.2 percent of the population is estimated (pre-COVID) to live in poverty,[5] state legislators are considering expansion of TANF eligibility (via a bill labeled “Work First New Jersey”). This expansion of the state’s safety net would increase the number of families who qualify for benefits; but it may not sufficiently address the growing number of households lacking necessary resources. To better understand the social and economic landscape of New Jersey, this research insight explores cost of living and poverty count trends.
Measuring poverty and counting the poor
Poverty is a complex and nuanced phenomenon. Establishing a consistent definition and measure is paramount to study trends and to develop effective policy. For instance, the estimated number of New Jerseyans living in poverty varies considerably depending on the approach applied. Based on the federal poverty level, almost 800,000 New Jerseyans lived in poverty in 2019,[6] whereas estimates based on the “True Poverty Level”[7] suggest that close to 3 million residents—a third of the state’s population—lived in poverty that same year. This substantial discrepancy in estimates underscores the importance of understanding poverty measures.
The official U.S. government measure of poverty, the federal poverty level (FPL) has applied an absolute approach to count the number of people living in poverty. Since the FPL was based on a set standard of scarcity;[8] those below the minimum subsistence standard are considered poor. In 2019, pre-tax income of $25,926 for a family of four (two adults and two children) constituted the poverty threshold.[9] Using this measure, the U.S. Census Bureau estimated that approximately 800,000 individuals (9.2% of the population) lived below the poverty line in New Jersey.[10]
Due to the central role of the FPL in determining eligibility for welfare programs and in-kind benefits, the official federal method for counting the poor has become a point of debate among academics, policymakers, and practitioners. The FPL is most often criticized for (1) its outdated estimates on family expenditures and (2) its inability to account for assets and debt.[11] Developed in the early 1960s, the FPL assumes that families spend about a third of their income on food. Now food comprises just a seventh of a family’s budget since costs of housing, childcare, health care, and transportation have skyrocketed.[12] Exacerbating matters, the FPL does not vary across the contiguous U.S., ignoring cost-of-living differentials (except for residents of Hawaii and Alaska). In the main, the FPL varies only with family size and inflation.
The second shortcoming of the FPL pertains to its failure to account for non-income assets and debt. For instance, numerous households would be counted as poor if the FPL considered interest payments on consumer debt. In fact, Pressman and Scott (2010)[13] estimate that once indebtedness is considered about four million additional Americans fall below the poverty line. The FPL formula also fails to account for in-kind benefits, tax expenditures and tax costs, and expenses related to generating income (e.g., childcare, internet, and transportation). Furthermore, critics of the FPL argue that the poverty count is affected by underreporting of income and the exclusion of the homeless population.
One alternative to the FPL is the so-called True Poverty Level (TPL). It addresses several of the limitations of the FPL. The TPL relies on a market-based analysis to determine the cost of and access to seven essential needs: housing, child-care, food, transportation, health care, taxes, other essentials (e.g., clothing, diapers, hygiene items). The analysis is performed at the county level and varies with family composition and the age of children. In addition, the TPL assumes that the adults in a household work-full time, and incorporates the full costs of housing, including the commute to work and childcare.[14],[15] Given this broader set of considerations, the TPL provides a conservative budget— though not as conservative as the FPL thresholds.
Figure 1.1 displays the TPL (i.e., the minimum income needed to sustain a four-person family) for New Jersey’s counties in 2019. Figure 1.1 highlights the notable differences in cost of living across New Jersey, providing further evidence of the limitations of the FPL In most New Jersey counties, the TPL surpasses the FPL for a four-person family with two children (i.e., $25,926) by more than 300 percent.
Figure 1.1: True Poverty Level for a four-person family: NJ Counties, 2019
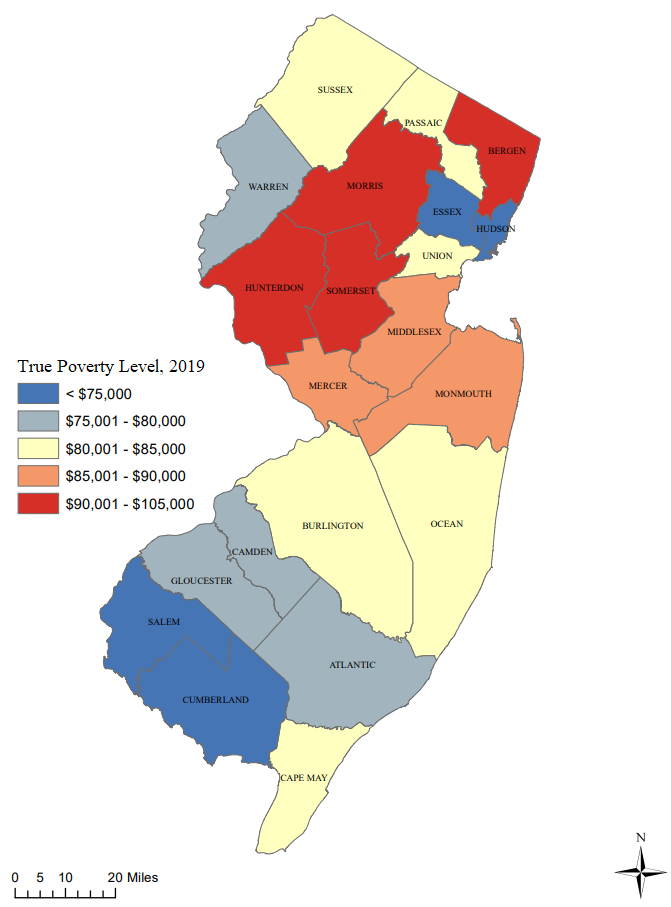
Source: Poverty Research Institute, 2021 (see endnote 8). Prepared by Rutgers Economic Advisory Service (R/ECON™)
Both the FPL and TPL measures have limitations, but collectively they provide a reasonable perspective on the pervasiveness of poverty. In New Jersey in 2019, close to three million individuals[16] suffered some form of financial deprivation, including 798,262 who lived below the FPL (a conservative number in New Jersey where the cost of living is so high).[17]
Examining trends, the poverty rate in New Jersey rose through 2013—the end of the Great Recession—when it peaked at 11.4 percent (see Figure 1.2). While the state’s poverty rate has fallen since then, as of 2019 it had not yet returned to its 2008 nadir. Moreover, the share of the population living in poverty is anticipated to rise due the COVID-19 pandemic.[18]
Figure 1.2: Percent living in poverty (below FPL): NJ and U.S., 2008-2019
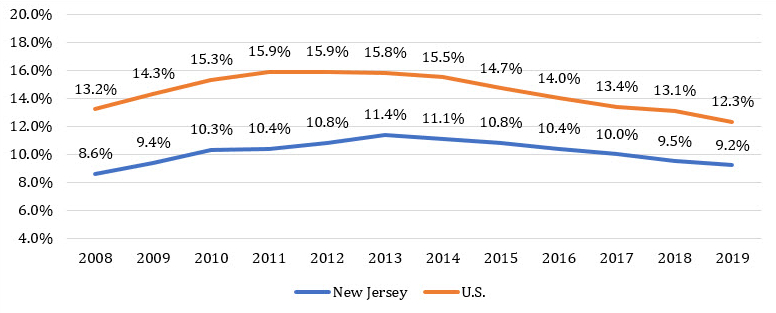
Source: U.S. Census Bureau, 2008-2019.[19] Prepared by R/ECON™.
Geographic distribution
The 2019 American Community Survey (ACS) five-year estimates report the official poverty rate in New Jersey at 10.0 percent, ranging from 4.5 percent (Hunterdon County) to 16.5 percent (Cumberland County).[20] Figure 1.3 illustrates the distribution of poverty across the state.[21]
The patterns observed in Figure 1.3 comport with those depicted in the True Poverty Level cost map (Figure 1.1) (i.e., poverty is concentrated in “more affordable” counties). That is, counties with the highest “True Cost of Living” (e.g., Hunterdon, Morris, and Somerset) have some of the lowest poverty rates in the state. In contrast, the counties with the lowest “True Cost of Living” (e.g., Essex, Hudson, and Cumberland) recorded the highest poverty rates.
Figure 1.3: Percent living in poverty (below FPL): NJ Counties, 2019
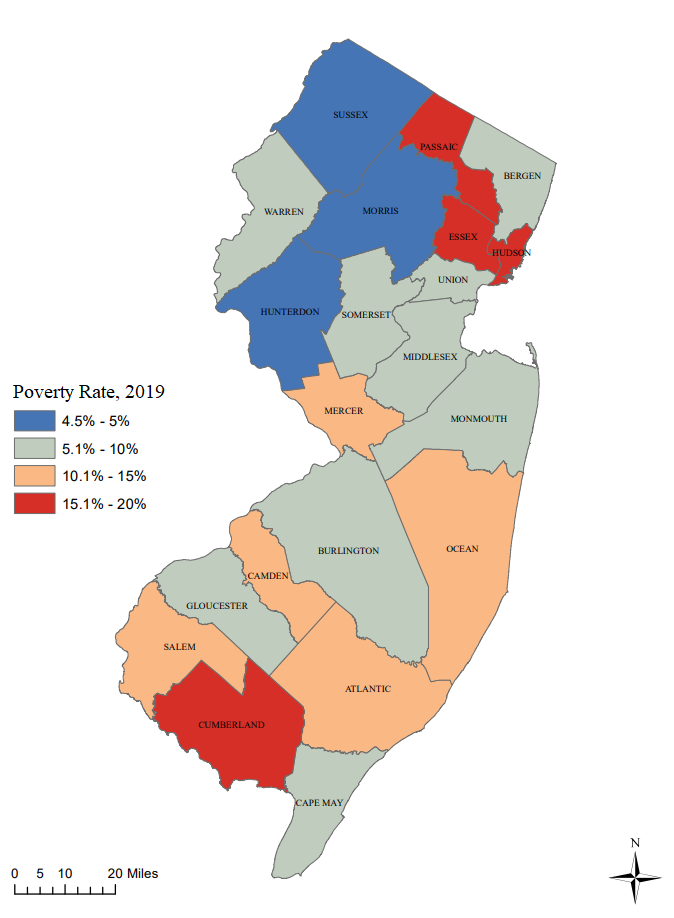
Source: U.S. Census Bureau, 2019 (see endnote 21). Prepared by Rutgers Economic Advisory Service (R/ECON™)
Acknowledgements
With great much gratitude, I acknowledge Tia Azzi who produced the various maps herein. I also thank Michael Lahr, Director of R/EconTM, and Elizabeth Cooner, Executive Director of the New Jersey State Policy Lab, for their review of and editorial work on this piece.
References
[1] Laborde, D., Martin, W., & Vos, R. (2020). Poverty and food insecurity could grow dramatically as COVID-19 spreads. International Food Policy Research Institute (IFPRI), Washington, DC.
[2] Kochhar, R. & Sechopoulos, S. (2022). COVID-19 pandemic pinches finances of America’s lower- and middle-income families. Pew Research Center. Retrieved from: https://www.pewresearch.org/social-trends/2022/04/20/covid-19-pandemic-pinches-finances-of-americas-lower-and-middle-income-families/
[3] He, Z. & Sun X. (2021, December 15). Impact of inflation on household income. Penn Wharton Budget Model. Retrieved from: https://budgetmodel.wharton.upenn.edu/issues/2021/12/15/consumption-under-inflation-costs.
[4] See endnote 2.
[5] U.S. Census Bureau (2019). S1701 Poverty Status in the Past 12 Months. 2019 American Community Survey 1-Year Estimates.
[6] Ibid.
[7] Poverty Research Institute. (2021). True poverty: What it takes to avoid poverty and deprivation in the Garden State. Legal Services of New Jersey. Retrieved from: https://www.lsNew Jersey.org/PRIResearchReports.aspx
[8] Scarcity was officially established by Mollie Orshansky in 1963 and was based on a family income that was less than three times the cost of a minimum food diet, adjusted for inflation.
Orshansky, M. (1963). Children of the poor. Social Security Bulletin, 26(7), 3–13. Retrieved from: https://www.ssa.gov/policy/docs/ssb/v26n7/v26n7p3.pdf
[9] U.S. Census Bureau (2019). Poverty Thresholds. Retrieved from: https://www.census.gov/data/tables/time-series/demo/income-poverty/historical-poverty-thresholds.html
[10] This figure is reported in the 2019 ACS one-year estimates (see footnote 5). Note the 2019 ACS 5-year estimates report a 10.0 percent poverty rate or 869,081 individuals living below the poverty line.
[11] Fass, S. (2009). Measuring poverty in the United States. National Center for Children in Poverty. Retrieved from: https://www.nccp.org/wp-content/uploads/2020/05/text_876.pdf
[12] Ibid.
[13] Pressman S. and Scott, R. H. Consumer debt and poverty measurement. Focus, 27(1), 9-12.
[14] See endnote 7.
[15] This assumption represents one of the model’s strengths and limitations. Other limitations are that it assumes employer-sponsored health insurance, does not account for expenses related to financially supporting a senior or disabled family member, and does not include costs related to internet/computer and vehicle purchase.
[16] See endnote 7.
[17] Ibid.
[18] See endnote 2.
[19] U.S. Census Bureau (2008-2019). S1701 Poverty Status in the Past 12 Months. American Community Survey 1-Year Estimates.
[20] U.S. Census Bureau (2019). S1701 Poverty Status in the Past 12 Months. 2015-2019 American Community Survey 5-Year Estimates.
[21] It is important acknowledge discrepancies among different Census surveys that apply the FPL when reporting poverty. For example, poverty estimates from the Annual Social and Economic Supplement of the Current Population Survey (CPS) tend to deviate somewhat from those from the American Community Survey (ACS), due in part to differences in collection methods and sample size. Furthermore, there are also differences within the ACS data depending on the estimates’ time interval. For instance, the 2019 ACS one-year estimates (based on a one percent sample) report that 798,262 individuals (9.2%) lived in poverty in New Jersey, while ACS five-year estimates for the same year (based on a five percent sample) suggest 869,081 individuals (10.0%) lived in poverty.[21] We report data from the five-year ACS since the U.S. Census Bureau recommends the use of these estimates for areas with less than 65,000 people (i.e., most New Jersey municipalities and Salem County). Ultimately, rather than placing too much emphasis on obtaining an exact count of “the poor”, the rest of the report analyses the poverty dynamics and trends in New Jersey, including an assessment of geographic concentration of poverty and the most vulnerable population groups.