
New Jersey is consistent in featuring at the top of the ranks for two different variables: effective real estate property tax rates and quality of K-12 education services.[1][2] These, unsurprisingly to most who reside here, are not unrelated in the slightest. Each of New Jersey’s whopping 599 school districts is funded to a significant degree by local property taxes.[3][4] Each one boasts a varying proportion of monies coming from local sources as such and the rest coming from state “Equalization Aid.” This formula is referred to as the “Adequacy Budget.”
According to the New Jersey School Boards Association, “In short, for every school district the state calculates what would be the necessary funding level to provide a ‘thorough and efficient education’ to every pupil in that district… the state then calculates the Local Cost Share; or, what it believes the local taxing authority would be able to raise and earmark for the school district’s budget. The difference between the Adequacy Budget and the Local Cost Share, if one exists, is covered by the state through Equalization Aid.”[5]
There are 31 districts in the state that receive large amounts of Equalization Aid in the form of full funding provided by the state Schools Development Authority (SDA) for school facilities capital, emergent, and Regular Operating District (ROD) grant projects.[6] These are known officially as SDA Districts, but colloquially as “Abbott Districts” after the landmark 1985 Abbott v. Burke case. These districts, uncoincidentally, also often happen to be the ones that bear the burden of the highest municipal property tax rates in the state- especially when juxtaposed with higher-income districts that fund their schools mainly through local taxes (receiving low amounts of Equalization Aid).
More often than not, even though higher-income districts pay proportionately less in municipal property taxes and receive less money from the state, they are equipped with higher dollar amounts in per-pupil funding and perform exceptionally higher in academic achievement benchmarks than the Abbott Districts do. Analyzing numerous variables sourced from the New Jersey Department of Education, New Jersey Department of Community Affairs, and the U.S. Census Bureau for both Abbott Districts and their highest-income municipality-fed counterpart districts in the same county, we find the following disparities in local taxes paid, funding allocated, and academic achievement.
In Essex County, Irvington Public School District, encompassing a municipality with a median household income of $44,898 (2020) and a municipal property tax rate of 5.98%, sourced only 11% of their funding from local tax levies and held a $19,365 total operating budget per-student enrolled for the 2020-2021 school year. Meanwhile, Essex Fells School District, encompassing a municipality with a median household income of $215,104 (2020) and a municipal property tax rate of 2.04%, sourced almost 92% of their funding from local tax levies and held a $22,238 total operating budget per-student enrolled for the same year. For the 2018-2019 school year, Irvington had an overall English Language Arts Proficiency Rate of 27.3%, while Essex Fells had an 85.8% rate; Irvington had a Math Proficiency Rate of 14.5% while Essex Fells had one of 82.1%.
This pattern continues to exemplify itself throughout the state in multiple other sampled counties shown below:
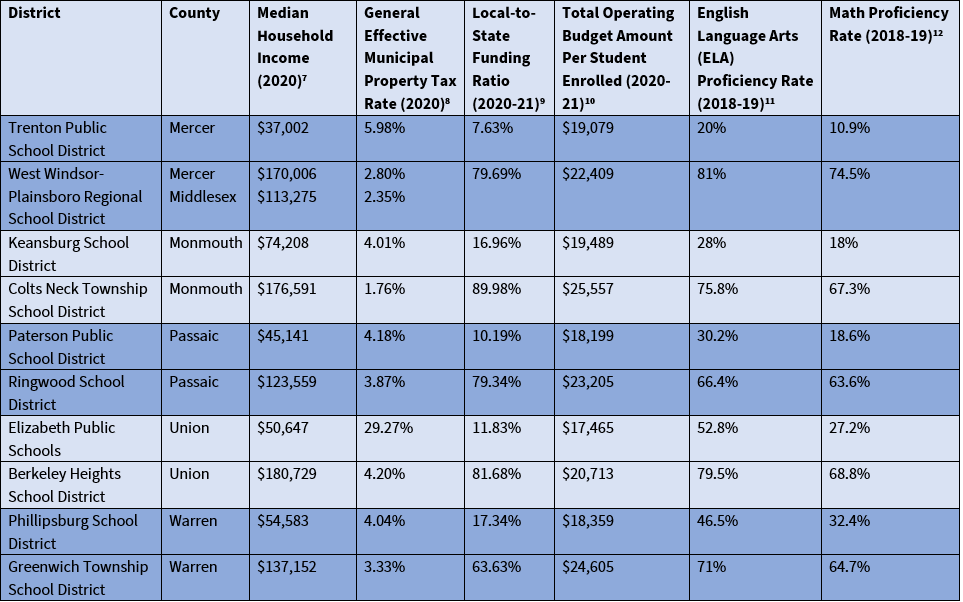
Clearly from this scenario, municipalities with lower average incomes are disproportionately burdened by higher property tax rates which generate proceeds that mostly do not get allocated to their schools. Even with the state aid equalization, their districts have disparately lower operating budgets overall, and lower academic achievement rates. While New Jersey may rank at the top of the list in terms of quality of K-12 education, it may be time to start thinking about funding policy changes for our underprivileged districts.
James Barnett is a graduate student at the Edward J. Bloustein School of Planning and Public Policy working toward his Master of City and Regional Planning degree with a concentration in Urban Development/Redevelopment. He is passionate about building equitable and sustainable communities while respecting their existing built environment and culture.
References:
[1] Brett Ziegler, Education Rankings: Measuring how well states are educating their students, (U.S. News & World Report).
[2] John S. Kiernan, Property Taxes by State, (WalletHub, 2022).
[3] New Jersey Public Schools Fact Sheet, (State of New Jersey Department of Education).
[4] Explainer: How Are Schools Funded in New Jersey, and Why Are My Property Taxes So High?, (NJ Education Report, 2021).
[5] School Finance 101, (New Jersey School Boards Association).
[6] What We Do, (State of New Jersey Schools Development Authority).
[7] QuickFacts: United States, (U.S. Census Bureau).
[8] Property Tax Information, (State of New Jersey Department of Community Affairs).
[9] User Friendly Budgets 2020-21, (State of New Jersey Department of Education).
[10] Ibid.
[11] NJ School Performance Report, (State of New Jersey Department of Education).
[12] Ibid.