
To gain a clear understanding of racial and ethnic disparities related to poverty, it is most important to focus on the poverty rate rather than the poverty count. According to the results presented in Figure 1.1, a much greater share of Black (17.3 percent) and Hispanic (17.9 percent) New Jerseyans lived in poverty in 2019 than of Asian (6.7 percent) and White, non-Hispanic (5.9 percent) residents.
Figure 1.1 displays the number and percent of individuals living in poverty, by race and ethnicity, in New Jersey in 2019. In absolute terms, the Hispanic population had the highest number of individuals living in poverty, at 315,902, followed by the White, non-Hispanic population (i.e., the state’s racial majority), which had 285,686 individuals living in poverty. Note that the American Community Survey does not provide estimates on non-Hispanic Black and non-Hispanic Asian individuals, thus, not allowing for consistent race group comparisons; however, general population data indicates that only 6% of Black individuals and 1% of Asian individuals are Hispanic, suggesting that the absence of poverty data on Black, non-Hispanic adults and Asian, non-Hispanic adults is not significant to the study of general poverty trends.[1]
Figure 1.1: Individuals living in poverty (count and rate) by race/ethnicity: NJ in 2019
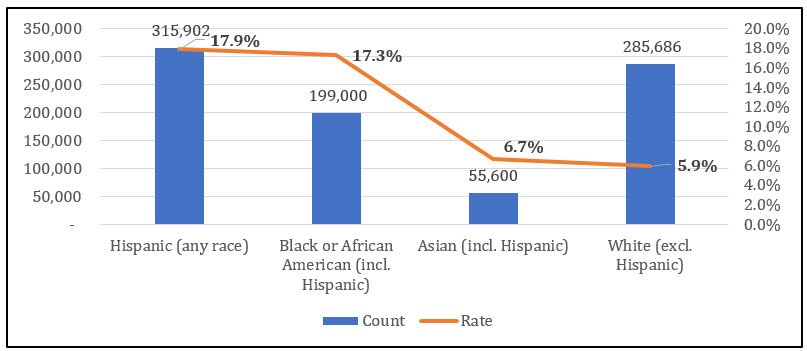
Source: U.S. Census Bureau, 2019 (see endnote 3). Prepared by R/ECON™.
To examine whether these recorded racial and ethnic inequalities occur uniformly across the state, Figure 1.2 displays the poverty rate by race and ethnicity by county in 2019.[2] Consistent with the trends depicted in Figure 1.1, the results reveal that Black and Hispanic residents were more likely to live in poverty than were White, non-Hispanic residents in all New Jersey counties. The results, however, demonstrate important differences in the magnitude of these disparities across counties. For instance, the distribution of poverty across racial/ethnic groups in counties like Burlington and Sussex was slightly more balanced than in counties like Atlantic and Salem. Moreover, variance in poverty rate was notably smaller for the White, non-Hispanic population, than for Black and Hispanic individuals, meaning that the share of White residents living in poverty was more evenly distributed across the state’s counties.
Figure 1.2: Percent living in poverty by race/ethnicity: NJ Counties, 2019
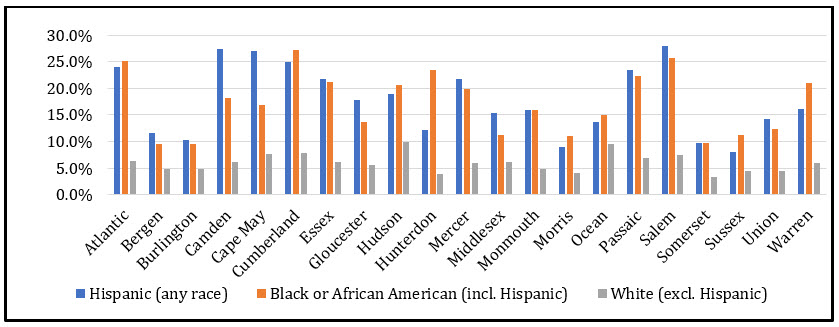
Source: U.S. Census Bureau, 2019 (see endnote 3). Prepared by R/ECON™.
Table 1.1 shows that over half of all New Jerseyans living in poverty (53 percent) are concentrated in just 30 of the 565 of the state’s municipalities. In other words, out of the total number of individuals living in poverty in New Jersey (869,081)[3], 460,321 of them live in the 30 municipalities listed in Table 1.1. When compared to Figure 1.3, these results underline the level of segregation sustained by the most economically disadvantaged New Jersey residents.
Table 1.1. Individuals living in poverty (count and rate): Select NJ Municipalities, 2019
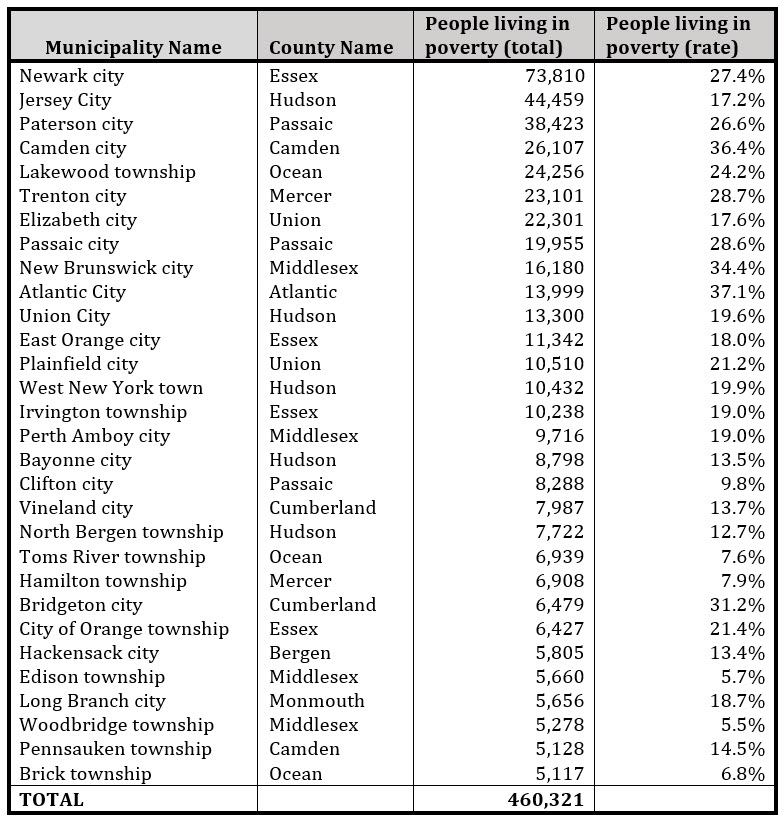
Source: U.S. Census Bureau, 2019 (see endnote 4). Prepared by R/ECON™.
The last two columns of Table 1.2 display the labor-force participation rate by sex (workers ages 20 to 64). Cumberland County is an outlier in terms of its male labor-force participation: just 65.0 percent of its working-age male population was employed or seeking employment in 2019, well below the state’s rate of 85.2 percent. In comparison, Morris County had the highest male labor-force participation rate at 90.0 percent. Cumberland County also had the state’s lowest county-based female labor-force participation (70.0 percent), while Hunterdon County had the highest (80.1 percent). Note that the male labor-force participation rate varies more across counties than does the female labor-force participation rate: that for men ranges from 65.0 to 90.0 percent, while that for women ranges from 70.0 to 80.1 percent.
Of the nine counties (highlighted below) with above-state-average poverty rates,[4] all but Hudson had below-average male labor force participation rates. This suggests that their working-age residents endure both lower levels of compensation and higher unemployment rates than do equivalent residents of counties with low poverty rates. Displaying a similar trend, most of the counties with above-state-average poverty rates (with the exception of Atlantic, Camden, and Essex), recorded below-average female labor force participation rates.
Table 1.2. Poverty, Income, and Labor Force: NJ Counties, 2019
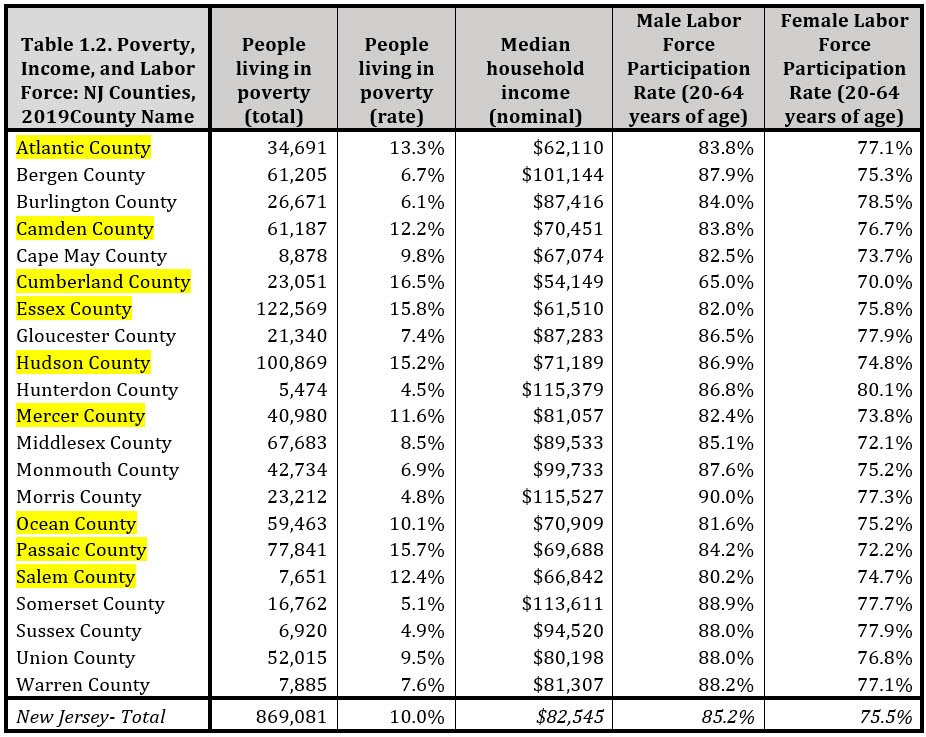
Source: U.S. Census Bureau, 2019.[5],[6],[7] Prepared by R/ECON™.
References
[1] U.S. Census Bureau (2019). B03002 Hispanic or Latino Origin by Race. 2015-2019 American Community Survey 5-Year Estimates.
[2] For clarity purposes, due to having too many data points, Figure 1.5 excludes the racial group with the lowest number and percentage of individuals living in poverty, Asians.
[3] U.S. Census Bureau (2019). S1701 Poverty Status in the Past 12 Months. 2015-2019 American Community Survey 5-Year Estimates.
[4] Ocean, Mercer, Camden, Salem, Atlantic, Hudson, Passaic, Essex, and Cumberland.
[5] U.S. Census Bureau (2019). S1701 Poverty Status in the Past 12 Months. 2015-2019 American Community Survey 5-Year Estimates.
[6]U.S. Census Bureau (2019). S1901 Income in the Past 12 Months (In 2019 Inflation-Adjusted Dollars). 2015-2019 American Community Survey 5-Year Estimates.
[7] U.S. Census Bureau (2019). S2301 Employment Status. 2015-2019 American Community Survey 5-Year Estimates.