
Background and National Trends
The connection between expanding access to high-quality and rigorous coursework and improving postsecondary outcomes is well established within the literature. According to the U.S. Department of Education (2010), a rigorous high school course load can be evidenced by a student’s participation in at least two Advanced Placement (AP) courses. Since its inception in 1952, the College Board’s AP program has provided high school students with introductory college-level courses across the nation. The College Board offers courses and exams across the following subject areas: Arts, English, History and Social Sciences, Math and Computer Science, Science, and World Languages and Culture (College Board, 2012). These AP exams allow students to earn college credit while still in high school upon passing a standardized exam in the corresponding subject area with a score of three or higher (College Board, 2018). With financial support from the New Jersey State Policy Lab, the Joseph C. Cornwall Center for Metropolitan Studies is working to understand factors that may impede equitable access to higher education in New Jersey.
Providing equitable access to AP courses and exams could help address disparities in postsecondary outcomes (Challenge Success, 2013; Lichten, 2010; U.S. Department of Education, 2000). The claim that the AP program can address disparities in college access is buttressed by research that associates successful course and exam completion with higher rates of postsecondary enrollment and persistence (Ackerman et al., 2013; Geiser & Santelices, 2004; Klopfenstein, 2010; Sadler & Sonnert, 2010; Speroni, 2011). These outcomes are believed to be, in part, due to the academic preparation and skillsets these courses offer to prepare students for the rigorous learning demands of college (Moore & Slate, 2008; Oakes, 2005; Raudenbush, Rowan, & Cheong, 1993). However, student’s successful completion of the AP standardized exam (as measured by a “qualifying score” of 3, 4, or 5) tends to be a much stronger predictor of college outcomes than AP course taking (Ackerman et al., 2013; Burns et al., 2019; Klopfenstein, 2010; Morgan & Klaric, 2007; Speroni, 2011).
Nevertheless, the disparity in AP course availability is a primary barrier to getting a diverse set of students to the point of AP success. Simply put, you can’t do well in an AP course, if you can’t take the course. The ETS (2008) released a foundational report examining how AP offerings differ across public schools with different socioeconomic, racial/ethnic, and geographic characteristics. The authors classified schools in terms of AP offerings as 1) “High AP” schools if they offered at least one AP mathematics exam, AP science exam, and AP English exam and 2) “Low AP” schools if they offered at least one AP exam but did not meet the “High AP” threshold. Data from this report revealed an apparent disparity in access to the AP program among Black and Latinx and low-income students. When the AP program is available, African American students are more likely to attend schools classified as “Low AP.” Consistent with these findings, Malkus (2016) found that high-poverty schools were among the group of schools least likely to offer AP classes. While scholars argue that academic rigor and quality of high school curriculum are important indicators for postsecondary success, we must recognize that access to AP courses is a site of inequity for many students.
A Closer Look at AP Mathematics and Computer Science Course Offering, Enrollment, and Testing in New Jersey
A preliminary look at the New Jersey Department of Education School Performance data shows disparities in AP course offering between schools with 50 percent or more of students who are economically disadvantaged and have 90 percent or more non-White students (segregated schools), compared to schools that are economically and racially mixed (non-segregated schools). However, there are much narrower disparities in AP course enrollment and test-taking.
Looking at AP mathematics and computer science courses, for example, the gap in course offerings is as wide as 53 percentage points as is the case for AP Statistics in the 2019-2020 school year (Figure 1). For courses like AP Calculus AB and AP Computer Science A, the gap in course offerings has been widening between the two types of schools, with the disparity growing about 10 and 14 percentage points respectively between 2015-2016 and 2019-2020. On the other hand, for courses like AP Computer Science Principles, the gap in course offerings has been narrowed by about two percentage points between 2016-2017 and 2019-2020.
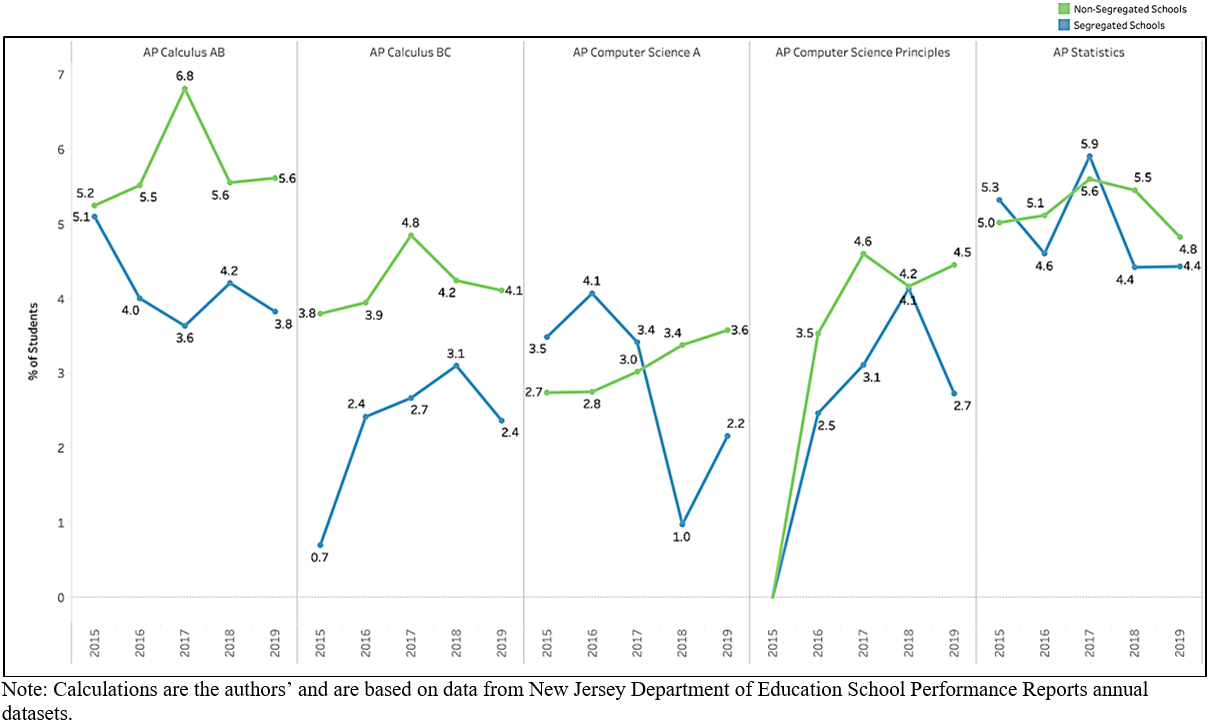
Across the state, on average, fewer than 10 percent of 11th and 12th graders are enrolled in AP Math and Computer Science courses, suggesting low take-up overall. However, disparities in AP Math and Computer Science course take-up are much smaller than disparities in course offerings. There is virtually no disparity in take-up for some courses, as with AP Statistics and AP Computer Science Principles. Disparities in AP testing in Math and Computer Science courses are also narrower than the disparities in course offerings, hovering at about 1-2 percentage points difference in later school years. Still, students in segregated schools do not take AP tests at the same rate as students in non-segregated schools. Overall, these findings could suggest that, when given the opportunity, students in segregated schools would take up and test in AP courses, which might signal an untapped opportunity to promote postsecondary success.
Figure 1: The gap in course offering between segregated and non-segregated is as wide as 53 percentage points.
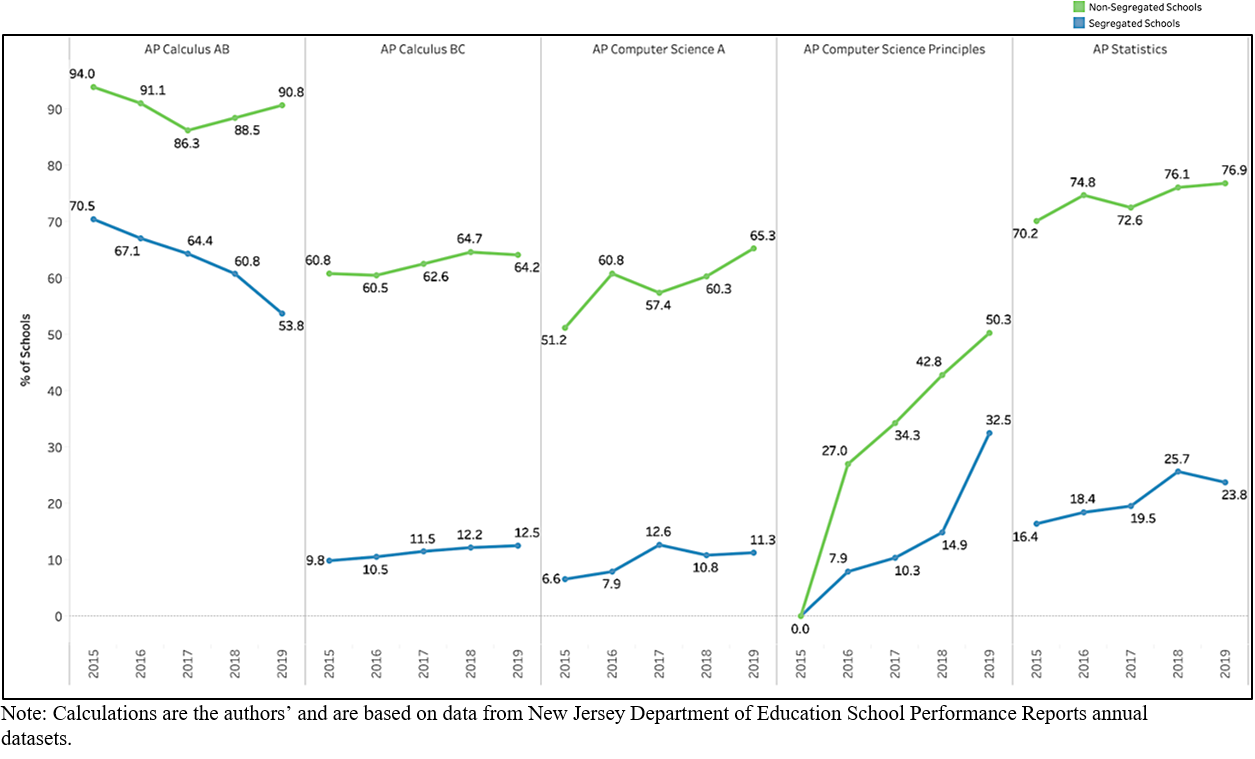
Figure 2: Students in segregated and non-segregated schools enroll in most AP Math and Computer Science courses at similar rates, sharply contrasting the wide disparities in course offerings.
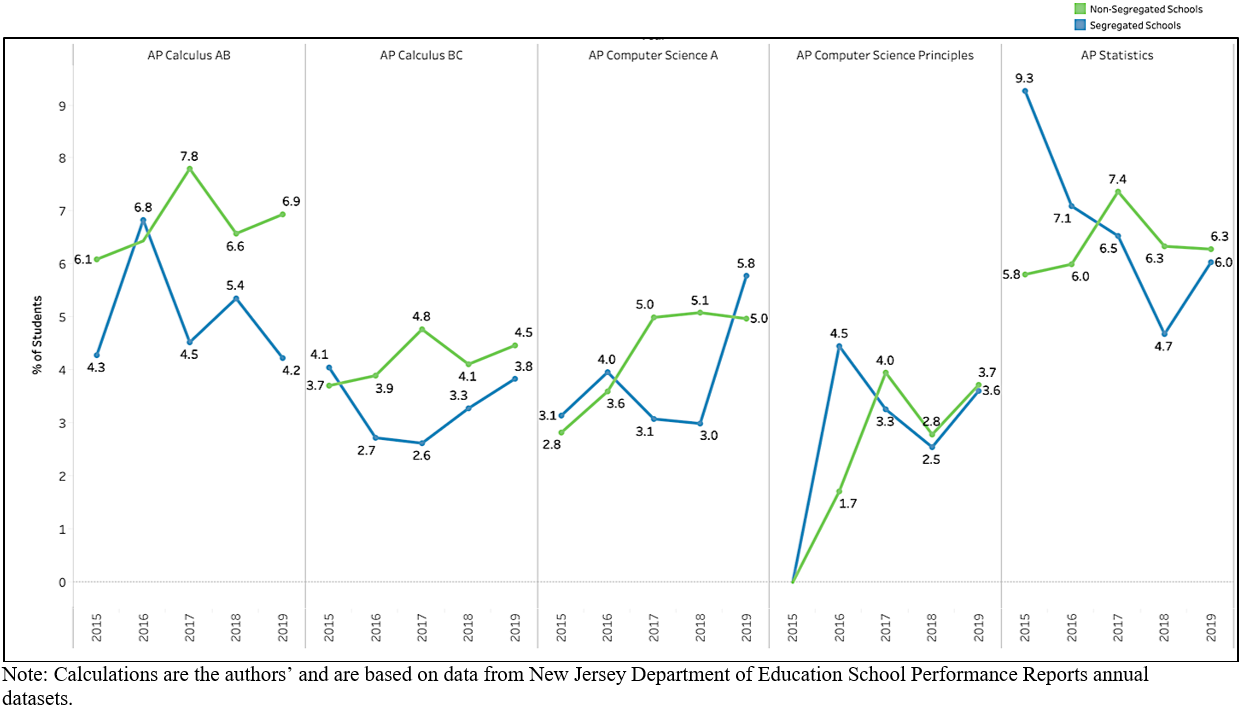
Figure 3: Disparities in AP mathematics and computer science testing rates hovers at about 1-2 percentage points difference between segregated and non-segregated schools in more recent years.
References
Ackerman, P. L., Kanfer, R., & Calderwood, C. (2013). High school advanced placement and student performance in college: STEM majors, non-STEM majors, and gender differences. Teachers College Record, 115(10), 1–43.
Burns, K., Ellegood, W. A., Bernard Bracy, J. M., Duncan, M., & Sweeney, D. C. (2019). Early college credit programs positively impact student success. Journal of Advanced Academics, 30(1), 27–49. https://doi.org/10.1177/1932202X18801274
Challenge Success. (2013). The Advanced Placement program: Living up to its promise?
College Board. (2012). AP Program participation and performance statistics [Data file]. Retrieved from https://research.collegeboard.org/programs/ap/data/archived/2008
College Board. (2018). Annual AP program participation 1956–2018. New York, NY: The College Board. Retrieved July 25, 2019 from: https://research.collegeboard.org/programs/ap/data/participation/ap-2018
Geiser, S., & Santelices, V. (2004). The role of Advanced Placement and honors courses in college admissions (Center for Studies in Higher Education Report No. 4.04). Retrieved from http://escholarship.org/uc/item/3ft1g8rz
Klopfenstein, K. (2010). Does the Advanced Placement program save tax- payers money? The effect of AP participation on time to college graduation. In P. M. Sadler, G. Sonnert, R. H. Tai, & K. Klopfenstein (Eds.), AP: A critical examination of the Advanced Placement program (pp. 189–218). Cambridge, MA: Harvard Education Press.
Lichten, W. (2010). Whither advanced placement—now? In P. M. Sadler, G. Sonnert, R. H. Tai, & K. Klopfenstein (Eds.), AP: A critical examination of the Advanced Placement program (pp. 233–243). Cam- bridge, MA: Harvard Education Press.
Malkus, N. (2016a). AP at scale: Public school students in Advanced Placement, 1990–2013. American Enterprise Institute.
Malkus, N. (2016b). The AP peak: Public schools offering Advanced Placement, 2000–12. American Enterprise Institute.
Morgan, R., & Klaric, J. (2007). AP® students in college: An analysis of five-year academic careers (Research Report No. 2007-4). College Board.
Moore, G.W., & Slate, J. R. (2008). Who’s Taking the Advanced Placement Courses and How Are They Doing: A Statewide Two-Year Study. The High School Journal, 92(1), 56–67. https://doi.org/10.1353/hsj.0.0013
Oakes, J. (2005). Keeping track: How schools structure inequality (2nd ed.). New Haven, CT: Yale University Press.
Raudenbush, S. W., Rowan, B., & Cheong, Y. F. (1993). Higher order instructional goals in secondary schools: Class, teacher, and school influences. American Educational Research Journal, 30(3), 523–553. https://doi.org/10.3102/00028312030003523
Sadler, P. M., & Sonnert, G. (2010). High school Advanced Placement and success in college coursework in the sciences. In P. M. Sadler, G. Sonnert, R. H. Tai, & K. Klopfenstein (Eds.), AP: A critical examination of the Advanced Placement program (pp. 119–137). Cambridge, MA: Harvard Education Press.
Speroni, C. (2011). Determinants of students’ success: The role of Advanced Placement and dual enrollment programs. National Center for Postsecondary Research.
U.S. Department of Education. (2000). A forum to expand Advanced Placement opportunities: Increasing access and improving preparation in high schools. Transcript of proceedings. https://eric.ed.gov/?id=ED448521
U.S. Department of Education Office for Civil Rights. (2010). Ensuring equal access to high-quality education. Retrieved from http://www2.ed.gov/about/offices/list/ocr/docs/ensure03.pdf