For many years, New Jersey has lost population via net in- and out-migration. From 2011 through 2019, this has resulted in the state hemorrhaging a total of more than $23.6 billion in net adjusted gross income (AGI) according to U.S. Internal Revenue Service (IRS) 2021 data. While education plays a role, the migration story for New Jersey largely centers on wealth. Among U.S. states, New Jersey has one of the top concentrations of millionaires (Young et al., 2016) and a rather progressive tax rate. Naturally, wealthier households that bear the highest tax burden are rather sensitive to taxation and can avoid some taxes by moving to a property in another state for a majority of each year.
Number of Returns & Number of Exemptions
New Jersey’s population has grown largely because births outnumber deaths (O’Dea, 2019). From 2016-2019, however, New Jersey has, in net, lost 106,722 individuals via interstate migration based on the number of IRS exemptions. Interestingly, the annual count of net migrants has steadily declined, as have both in- and out-migration flows.
Out-Migrants
Despite its distance from New Jersey, Florida had the third highest count of out-migrants from New Jersey since 2016 (and the second most in 2018-2019). But Florida has both a large population and no personal income tax, both of which lure migrants. Neighboring New York and Pennsylvania consistently capture the highest count of out-migrating New Jerseyans from 2016 onward.
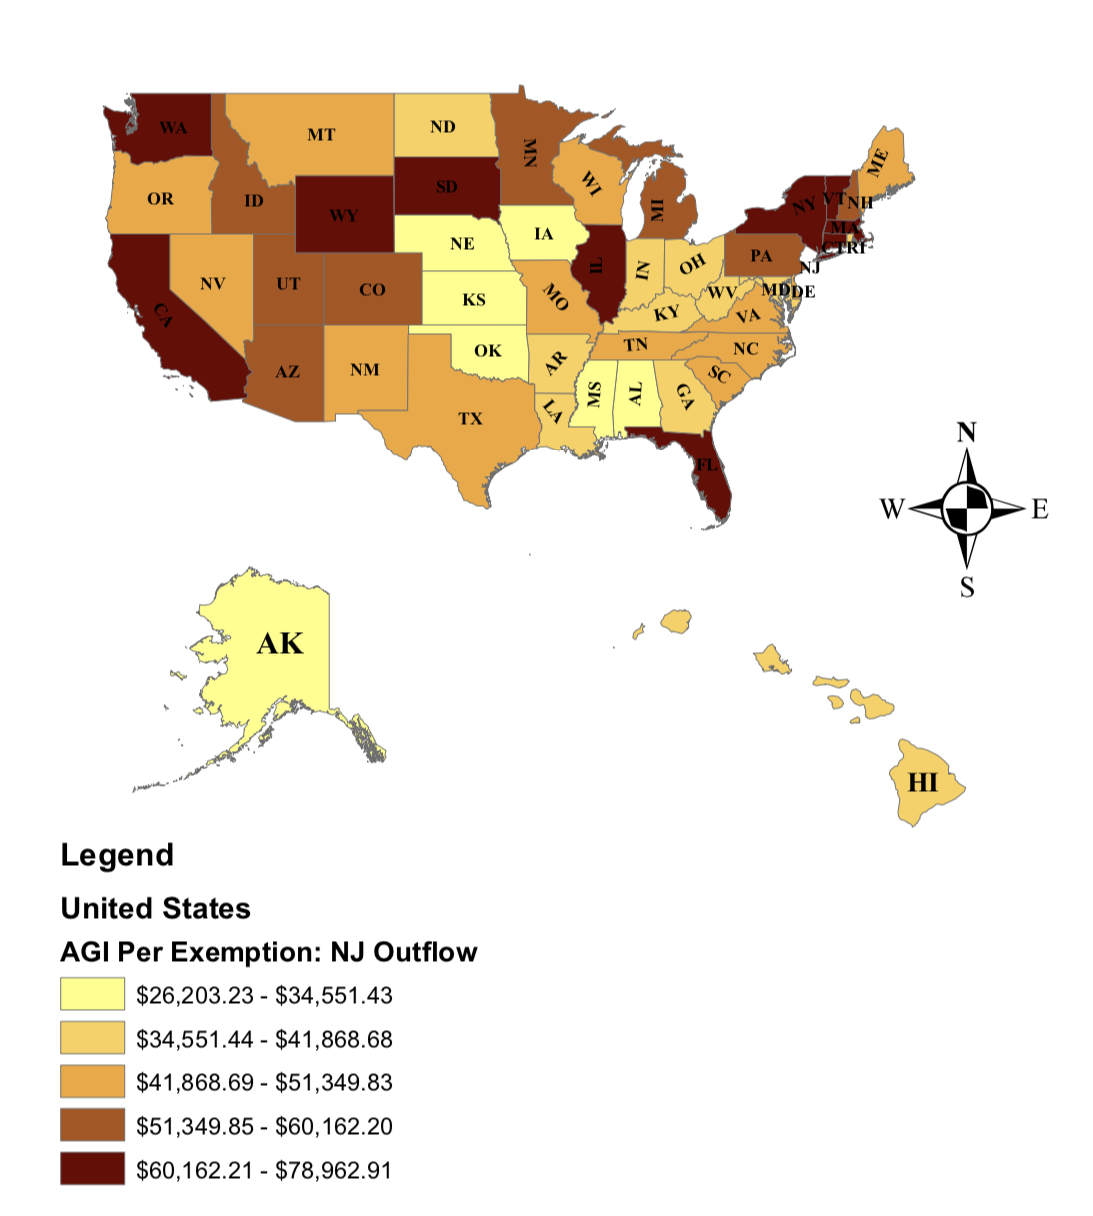
From 2018 to 2019, just five states— California, Florida, Massachusetts, New York, and Pennsylvania—composed 74.2% of all New Jersey out-migrants, but 80.7% of their AGI that year. Importantly, New Jerseyans moving to Florida had a higher average AGI than did those moving to other states (see Figure 1). The average AGI per out-migrant from New Jersey was about $62,250.
In-Migrants
Just as out-migration hurts New Jersey’s economy, in-migrants boost the state’s economy with added funds. California, Florida, New York, and Pennsylvania represent the top four states in terms of the count of in-migrants to New Jersey; they account for 81.6% of the state’s in-migrants and 80.3% of the concordant aggregate inflowing AGI. In fact, New York alone supplies about half of New Jersey’s interstate in-migrants as well as their AGI.
Conclusions
Seven of the ten most populous states are top-ten destinations for New Jersey out-migrants—New York, Pennsylvania, Florida, California, North Carolina, Texas, and Georgia. The enhanced availability of jobs is likely a major factor pulling New Jerseyans to these states. Based on AGI per migrant, wealthier families appear to prefer California, Florida, Illinois, and New York in which to resettle. New York state’s proximity and size are logical lures. Size and climates of California and Florida also have clear appeal, as does Florida’s lack of state income tax.
Finally, it was particularly notable that New York State is the only top-ten state in interstate migration exchange with New Jersey that had a higher rate of in-migration than out-migration. Despite New Jersey residents leaving for New York in large numbers, New Jersey obtained a net gain of 124,766 residents from New York from 2015 to 2018.
Figure 1: Average Adjusted Gross Income per New Jersey Out-Migrant by State, 2018-2019

Source: U.S. Internal Revenue Service. (2021). “SOI Tax Stats-Migration Data” with R/ECON calculations
References:
Bureau, US Census. (2020). Population estimates continue to show the nation’s growth is slowing. The United States Census Bureau, 2 January, available online in November 2021 at https://www.census.gov/newsroom/press-releases/2019/popest-nation.html.
O’Dea, C. (2019). Interactive Map: IRS Data Shows New Jersey Loses Out in Relocation Game. NJ Spotlight News, 18 January. Available online in November 2021 at https://www.njspotlightnews.org/2019/01/19-01-17-worried-about-nj-population-drain-check-out-irs-data/
Young, C., Varner, C., Lurie, I. Z., & Prisinzano, R. (2016). Millionaire migration and taxation of the elite: Evidence from administrative data. American Sociological Review, 81(3), 421-446. DOI: 10.1177/0003122416639625
Note that more detail can be found in our full report.
