
According to the New Jersey Department of Transportation (NJDOT), total traffic crashes each year typically exceed 200,000. New Jersey does not currently provide easy access to the data on these crashes. While New Jersey is not alone, some states such as Connecticut, California, and Maryland, among others, provide data portals and online maps displaying crash data and make it relatively easy for researchers and others to access their data.
New Jersey currently has two systems, Safety Voyager (operated by the NJDOT), and Numetric (operated by the NJ Division of Highway Safety) which are not publicly accessible, but NJDOT-funded researchers can get access. New Jersey provides raw data that are publicly downloadable, but with major limitations: the dataset does not contain geocoded coordinates and the latest available year is 2021. Until recently, New Jersey did not have a statewide public-facing map/dashboard. Researchers at the Children’s Hospital of Philadelphia published the New Jersey Traffic Safety Dashboard in May 2024, which contains aggregated injury statistics by county. Other regional dashboards exist, one for the Delaware Valley Regional Planning Commission (DVRPC) and another for Hudson County (with the latter also containing statewide statistics).
The public has an interest in knowing when and where crashes occur, partly so they can demand that authorities improve safety. Researchers have an interest in being able to download data and conduct analyses to better understand mechanisms that lead to crashes and assist decisionmakers in designing effective policies. The Fatality Analysis Reporting System (FARS) provides publicly available data for all fatal crashes in the United States. Fatal crashes make up less than 1% of all reported crashes and it is important not to rely solely on fatalities for decisionmaking as many injury crashes can lead to major disabilities and lifelong impairment.
As part of this project, we conducted interviews with DOT staff throughout the country, as well as with university researchers responsible for data portals and transportation advocacy groups to delve into the importance of non-fatal crash data availability. There was a general consensus that this information is valuable for advocating for infrastructure changes to improve road safety. Fatal crash data alone is not enough, as there is randomness to whether a crash is fatal, which can be a matter of a few feet, vehicle size, or how someone was hit. The most serious injuries can be life-altering for the victims of these crashes.
To understand the impact of various safety policies implemented throughout the country, good quality and timely data is needed. This data must be easily accessible to and digestible by the research community, the public, and decisionmakers. With that, we documented crash data availability for each state and the District of Columbia. Our online tool allows one to access websites with crash data, including detailed dashboards by clicking on the state. We reviewed two main dimensions of crash data: raw crash data and dashboards (including those with interactive maps). Raw crash data is useful for researchers and transportation professionals to analyze traffic safety and trends, identify priority areas, and document factors influencing crashes. Dashboards and interactive maps are crucial for advocates and for the public to understand crash data in a user-friendly way.
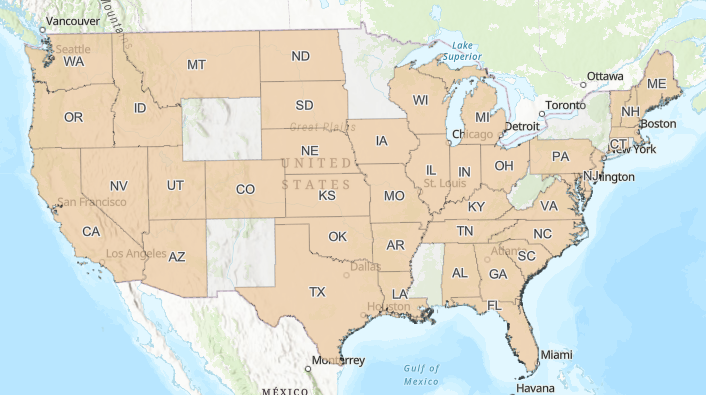
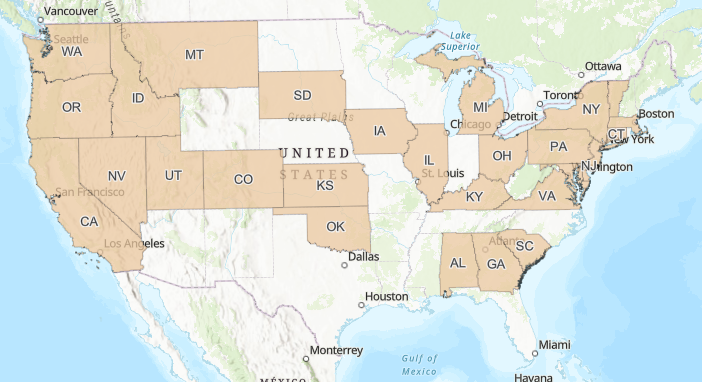
In the most open-data states, raw anonymized data is downloadable, and an interactive map/dashboard is provided for analysis. In the least open-data states, summary reports of annual crash data may be available to view. Forty-one states and the District of Columbia currently have a dashboard or interactive map publicly available. Twenty-seven states and the District of Columbia provide publicly downloadable crash data; this includes New Jersey (see Figure 1). Connecticut, Georgia, Massachusetts, and Utah stood out for having comprehensive mapping platforms, querying options, data export options, and timely and complete crash information. Michigan is the only state that provides free redacted crash reports (including narratives and diagrams) to the public.
Numerous states provide non-fatal crash data for download, although the data available varies. Some states, e.g., California, Nevada, Delaware, and South Dakota (among others) provide substantial information in their database. New Jersey’s publicly available crash data, in comparison, lacks basic attributes of crashes, including detailed geocoded information on where the crash occurred. They do provide information on the route milepost, but this is not easily translatable for ease of analysis and may be less precise than spatial coordinates.
What can New Jersey do to improve its data transparency? The dashboards already available through DVRPC (Camden, Burlington, Mercer, and Gloucester counties) and Hudson County Complete Streets are good examples of what a statewide dashboard could look like. The New Jersey State Police provide near-real time information on fatal crashes, but non-fatal crashes are not included. New Jersey’s publicly downloadable crash data needs to incorporate geocoded and timely information. Our nationwide interviews revealed many issues with data quality, timeliness of data, as well as potential solutions which we discuss in a forthcoming report to provide guidance on improving New Jersey’s traffic safety data and accessibility.
Figure 1: Raw crash data (bottom) and dashboard/map (top) availability by state (as of July 2024)[1]
References:
[1] Alaska and Hawaii had neither a dashboard/map nor public raw data downloadable statewide.