
Policy makers are grappling with the advent of a variety of new transportation technologies known as micromobility. These include e-scooters, e-bikes, as well as conventional bicycles. While these modes of travel offer many opportunities for more sustainable mobility there are concerns about the risk of injury, particularly those associated with e-scooters. In New Jersey, conventional bicycle and/or pedestrian-involved crashes make up just 3% of motor vehicle crashes but represent 30% of fatalities (Younes, Noland, Von Hagen, et al., 2023). E-scooters are often perceived as more dangerous than other micromobility modes, and we have begun to examine these issues.
Do e-scooters lead to more severe injuries than other micromobility modes? Which micromobility injuries are most commonly associated with a motor vehicle? What are some demographic differences related to e-scooter injuries (with equity implications)?
To answer these questions, we used the latest data from the U.S. Consumer Product Safety Commission (CPSC)’s National Electronic Injury Surveillance System (NEISS). The NEISS database is a stratified probability sample of emergency departments (EDs) within the United States (USCPSC, 2021). Their sampling frame includes hospitals with at least 6 beds and providing 24-hour emergency care. NEISS coders review and extract data from medical charts of patients who had product-related injuries for approximately 100 sampled hospitals across the nation. Case weights are included to produce a nationally representative estimate of injuries. In 2020, the CPSC updated their codebook to discern between e-scooters and skateboard injuries, offering the possibility to analyze injuries among three popular micromobility modes in the United States: bicycles, e-scooters, and e-bikes.
We analyzed hospital records for adults 18-84 years old from 2021 and 2022 which involved e-scooters, e-bikes, and bicycles. An initial look at the narratives did point to a limitation in the data: many of the presumed e-scooters and e-bikes were instead higher speed motorbikes and motor-scooters (i.e., Vespas), which are misclassified. We cleaned the data such that only standing e-scooters, low-speed e-bikes, and traditional bicycles would be included in our dataset. Our final sample contained: 11,911 bicycle injuries, 1,166 e-scooter injuries, and 655 e-bike injuries for a combined 13,732 micromobility injuries across the approximately 100 sampled hospitals in 2021 and 2022.
Are e-scooters really more dangerous?
We analyzed the severity of injury by looking at the hospital disposition, or the outcome. There are more bicycle-related injuries than either e-scooters or e-bikes, given the much larger number in use. Instead of absolute numbers, we analyzed in the proportion of injuries that are severe or fatal, in line with Vision Zero strategies. The vast majority of injured micromobility users who end up in an emergency department are treated and released without being admitted in the hospital. Those with e-scooter injuries are more likely to be treated and released (85%) than those with e-bike (81%) or bicycle injuries (79%), although not by a large margin. Fire-related injuries from a lithium battery explosion were present in one of the e-bike injuries (0.2%) and two of the e-scooter injuries (0.2%). Very few micromobility-related injured patients suffer fatal injuries, although based on the 2021 and 2022 datasets, a slightly higher proportion of cyclists suffered fatal injuries compared to e-bike and e-scooter users.
Initial results suggest that e-scooter users do not suffer more severe injuries compared to cyclists and e-bike users.
Table 1: Outcome of Injuries by Micromobility Mode
|
|
Bicycles | E-scooters |
E-bikes |
|||
|
Disposition |
||||||
| Treated and released | 9364 | 78.6% | 987 | 84.6% | 529 | 80.8% |
| Treated and transferred | 113 | 0.95% | 11 | 0.94% | 6 | 0.92% |
| Treated and admitted | 1823 | 15.3% | 111 | 9.5% | 88 | 13.4% |
| Held for observation | 107 | 0.90% | 9 | 0.77% | 5 | 0.76% |
| Left without being seen | 476 | 4.0% | 47 | 4.0% | 26 | 4.0% |
| Fatal | 27 | 0.23% | 1 | 0.09% | 1 | 0.15% |
Micromobility injuries associated with motor vehicles
Each injury in the NEISS database is accompanied by a short narrative explaining the circumstances of the injury. The database does not have a column indicating the presence of a motor vehicle, and thus, we had to rely on the narratives. While some are more descriptive than others, we extracted words related to motor vehicles (car, truck, etc.) to estimate the proportion of injuries likely due to an interaction with a motor vehicle. Because not all narratives provided a full description of circumstances, the proportions are likely underestimated. We found that motor vehicle-related terms were present in 25% of bicycle-related injuries, 23% of e-scooter injuries, and 33% of e-bike injuries.
Sociodemographic differences in micromobility injuries
Bicycle usage has long been dominated by white males. Recent work shows that e-scooters, in particular, may attract a more diverse population of users. Our recent observational research in Asbury Park confirmed the disparity in gender, although for a limited sample (Younes, Noland, & Andrews, 2023). These gender differences may also be reflected in injury rates, but there also may be other factors associated with individual risk taking. For instance, there is some evidence that women cyclists are less likely to be injured than men because they take fewer risks on a bike (Teschke et al., 2015). Furthermore, Black and Hispanic Americans are more likely to suffer a fatal injury while cycling than white riders at least on a per mile basis (Raifman & Choma, 2022), and this may be due to less protective infrastructure (such as bike lanes) in these communities.
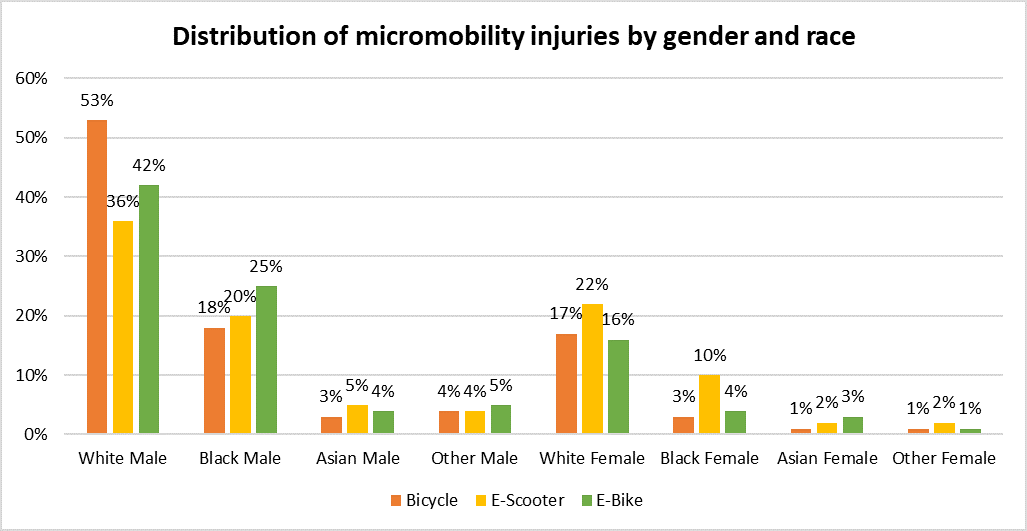
Among injured patients in the NEISS data, White males remain the most common patients across all micromobility groups, varying between 36% and 53% (Figure 1). Persons presenting with an e-scooter injury are more diverse with respect to gender and race compared to people having an injury from a bicycle or e-bike crash or fall. They are more likely to be women and/or a minority compared to bicycle and e-bike injured users. E-bike injured persons are also more diverse than injured bicyclists, although less than injured e-scooter users. Hispanic/Latino ethnicity was incomplete in the datasets, particularly for e-bike users (55% of records had missing values). Among complete records, e-scooter users were more likely to be of Hispanic ethnicity, with 17% compared to 13% of bicyclists presenting with an injury.
Figure 1: Distribution of micromobility related injuries by gender and race
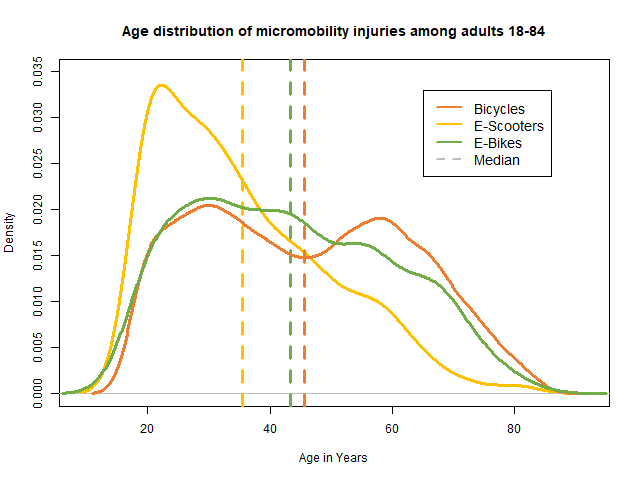
The age distribution of injured persons is in line with the distribution of the general population (Figure 2). E-scooter users are typically younger than bicyclists and e-bicyclists. In turn, we see a similar pattern with injured micromobility users. The median age for injured adult bicyclists and e-bicyclists is 45 and 42 years old, respectively, compared to 32 years for e-scooter users.
Figure 2: Age distribution of micromobility related injuries
Final thoughts
Micromobility users are vulnerable road users. NEISS data shows that e-scooter users do not have a greater risk of serious injury than bicyclists and e-bicyclists. Injured e-scooter users and e-bicyclists are more diverse, both in terms of gender and race/ethnicity than bicyclists. Injured e-scooter users are also younger than other injured micromobility users. The data can provide additional insights on the type of injury that the user suffered. Our next steps will include taking a deeper look at the type of injury, while differentiating between modes and whether a motor vehicle was involved.
There’s often a large belief that e-scooters are riskier and more dangerous than other modes of transportation. Cities have gone so far as to ban the use of shared e-scooters (e.g., Paris FR, New Orleans, and Las Vegas), although personal use of privately owned e-scooters still remains legal in these cities. In New Jersey, Princeton University recently issued a ban on personal electric vehicles (PEVs), including e-bikes and e-scooters, on most of its campus. Concerns about charging safety have also grown over the last few years, particularly following an e-bike lithium battery explosion in New York City in 2023. Fires related to e-bikes have frequently been due to poor quality and damaged e-bike batteries, including bad repairs of batteries.
Promoting the safe riding and charging of electric micromobility must be prioritized in order to counter the growing demonization of these devices. Vilifying and banning e-micromobility may present an equity issue. For instance, in New York City, a large proportion of e-bike and e-scooter users are delivery workers of minority and marginalized backgrounds. Some are turning to gas-powered mopeds because of the lack of proper and safe charging infrastructure, and of proposed laws aimed at preventing people from owning e-bikes rather than preventing fires. Similarly, using NEISS data, we found that a larger proportion of people presenting with e-micromobility injuries were of minority backgrounds, compared to traditional bicyclists.
Proper steps must be taken in order to promote safety in micromobility and prevent severe and fatal injuries. Following Vision Zero and Safe System Approach initiatives, micromobility safety must include: (1) proper e-micromobility infrastructure, including separated paths and charging facilities, (2) measures to calm motor vehicle traffic, such as reducing speed limits, narrowing lanes, and raising intersections, (3) ensuring good post-crash care in the case of an injury. Planners, engineers, and policy makers have for too long prioritized motor vehicles. As we move towards a more sustainable future, we must not only accommodate but embrace a multi-modal transportation system.
The landscape of transportation is rapidly changing and evolving: understanding the unique needs of vulnerable road users is necessary. E-bike and e-scooter sales have skyrocketed, particularly post-COVID. Women and minorities are more likely to use micromobility than in previous years. Protective infrastructure, especially in places that have been neglected in the past, must be prioritized.
References:
Raifman, M. A., & Choma, E. F. (2022). Disparities in Activity and Traffic Fatalities by Race/Ethnicity. American Journal of Preventive Medicine, 63(2), 160-167. https://doi.org/10.1016/j.amepre.2022.03.012
Teschke, K., Koehoorn, M., Shen, H., & Dennis, J. (2015). Bicycling injury hospitalisation rates in Canadian jurisdictions: analyses examining associations with helmet legislation and mode share [Article]. Bmj Open, 5(11), 12, Article e008052. https://doi.org/10.1136/bmjopen-2015-008052
US CPSC. (2021). NEISS Highlights, Data and Query Builder. Washington DC. https://www.cpsc.gov/cgibin/NEISSQuery/home.aspx
Younes, H., Noland, R. B., & Andrews, C. J. (2023). Gender split and safety behavior of cyclists and e-scooter users in Asbury Park, NJ. Case Studies on Transport Policy, 14, 101073. https://doi.org/https://doi.org/10.1016/j.cstp.2023.101073
Younes, H., Noland, R. B., Von Hagen, L.A., & Meehan, S. (2023). Pedestrian- and bicyclist-involved crashes: Associations with spatial factors, pedestrian infrastructure, and equity impacts. Journal of Safety Research. https://doi.org/https://doi.org/10.1016/j.jsr.2023.05.005