
A little over a year ago, we reviewed the latest data from the Census Bureau’s American Community Survey showing that in 2022 New Jersey had the highest median income in the country, coupled with housing costs also among the nation’s highest. Here we revisit these indicators and review the 2023 data released late last year.
With median household income of $99,781 in 2023, New Jersey once again remains near the top of the list of the highest income states, trailing only Massachusetts, which had median income just $77 higher at $99,858. New Jersey’s median household income grew by 3.6% compared to the prior year, slightly slower than that of the U.S., which grew 4% to $77,719.
While housing costs in New Jersey continue to be among the highest in the nation, the state growth rate of 4.8% for median owner costs for housing with a mortgage was among the slowest in the country (43rd) and well below the national rate of 7.2%. As a result, the state’s median monthly costs of $2,676 ranked 7th nationally in 2023, compared to 3rd in 2022. Nevertheless, the percentage of mortgaged homeowners in the state spending more than 30% of their income on housing costs ticked up in 2023 to 31.7% from 31.5% in 2022, with the state’s ranking rising from 6th to 5th, behind Hawaii, California, Florida and New York.
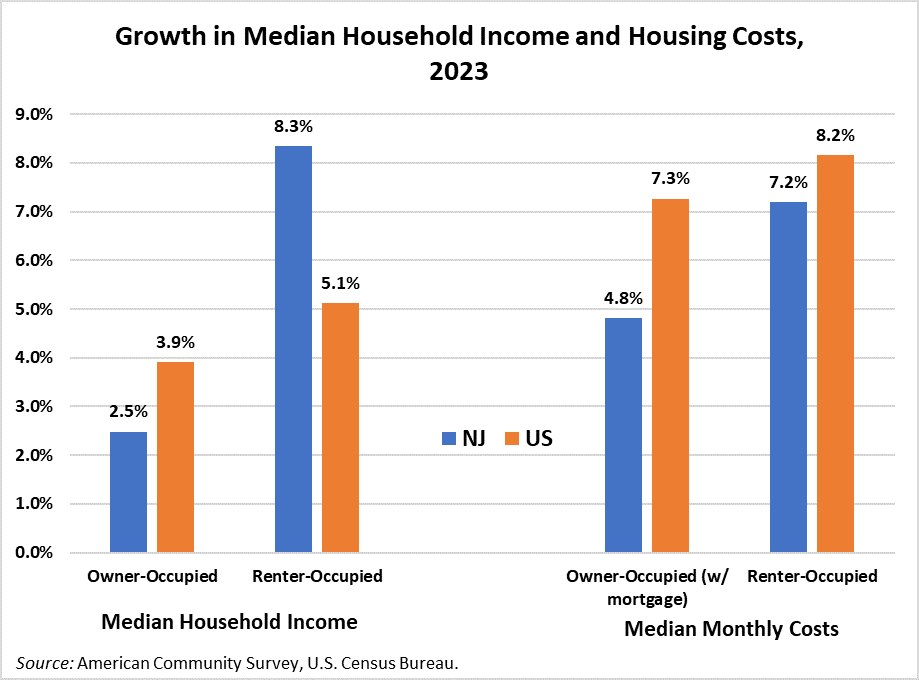
Median rents in New Jersey also grew at a slightly slower pace than the nation in 2023 (7.2% vs 8.2%) but continued to be among the country’s highest at $1,667. This ranked 8th in the nation, compared to 7th in 2022. Notably, the percentage of cost-burdened renters (those spending more than 30% of their income on housing costs) dropped from 49.7% (8th in the nation) in 2022 to 48.5% (15th) in 2023, as the median household income of renters rose by 8.3% to $61,685 (compared to 2.5% growth for owner households).
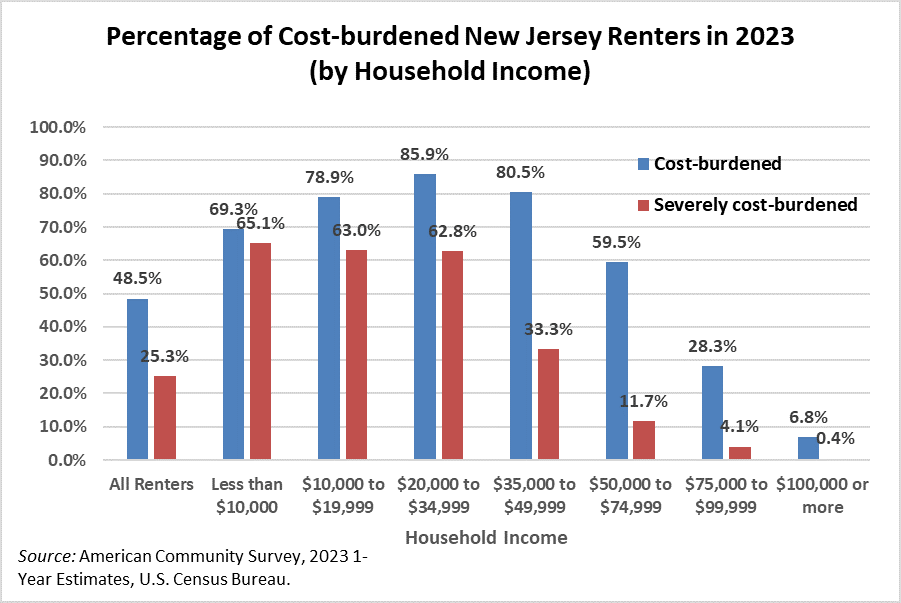
The weight of the state’s high housing costs continues to fall hardest on lower-income households, with 74% of those with household incomes below $75,000 (representing about 58% of total renter households) considered cost-burdened[1] (i.e., with rent and utilities accounting for more than 30% of household income) and 42% considered severely cost-burdened (with rent and utilities accounting for more than 50% of household income).
All data are from U.S. Census Bureau, 2022 and 2023 American Community Survey 1-Year Estimates.
References:
[1] The federal Department of Housing and Urban Development (HUD) considers renter households with housing cost ratios (rent and utilities as a percentage of income) of over 30% to be “cost-burdened” and those with ratios of over 50% to be “severely cost-burdened.”