
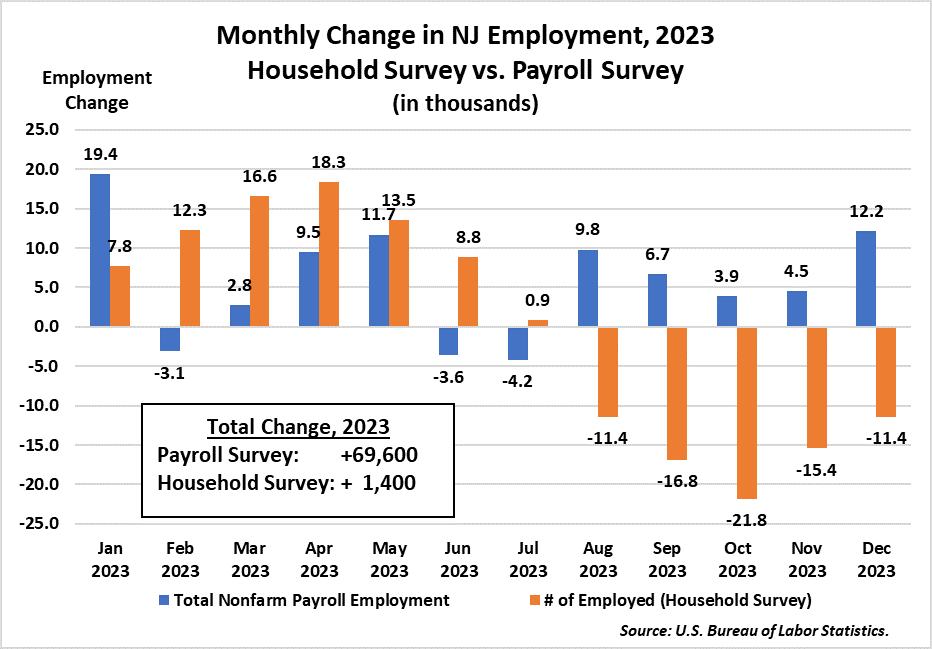
Monthly Change in NJ Employment, 2023 Household Survey vs. Payroll Survey Bar Chart
As 2024 began with yet another surprisingly strong jobs report for the U.S. (353,000 jobs added in January and the unemployment rate steady at 3.7%), and with a full year’s worth of 2023 state-level employment data now available [1], it’s worth briefly revisiting some of the trends discussed in our early December post on New Jersey’s employment situation.
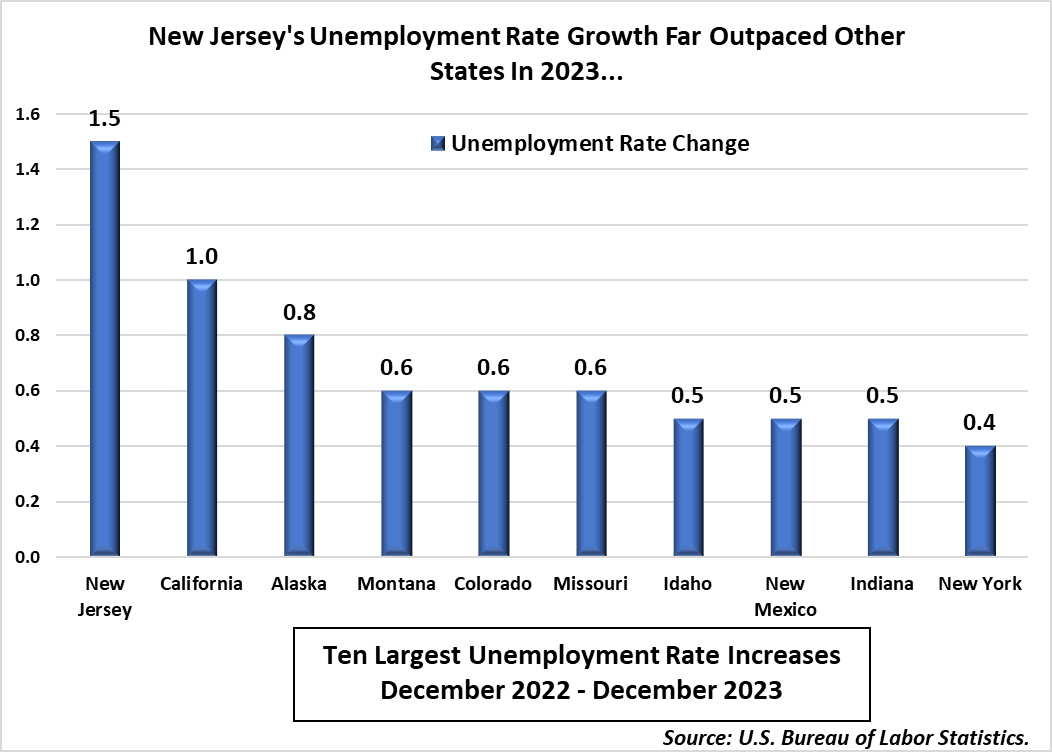
New Jersey’s unemployment rate continued to edge up slightly at year’s end, growing to 4.8% in December. This ranked third in the country, tied with Illinois but lower than Nevada (5.4%) and California (5.1%). Over the course of the full year, New Jersey’s rate rose by 1.5 percentage points, by far the fastest increase nationwide. Most of this increase came in the second half of the year. New Jersey’s rate grew by 1.1 percentage points from June to December, surpassing the rates of regional neighbors such as Connecticut, New York, and Pennsylvania.
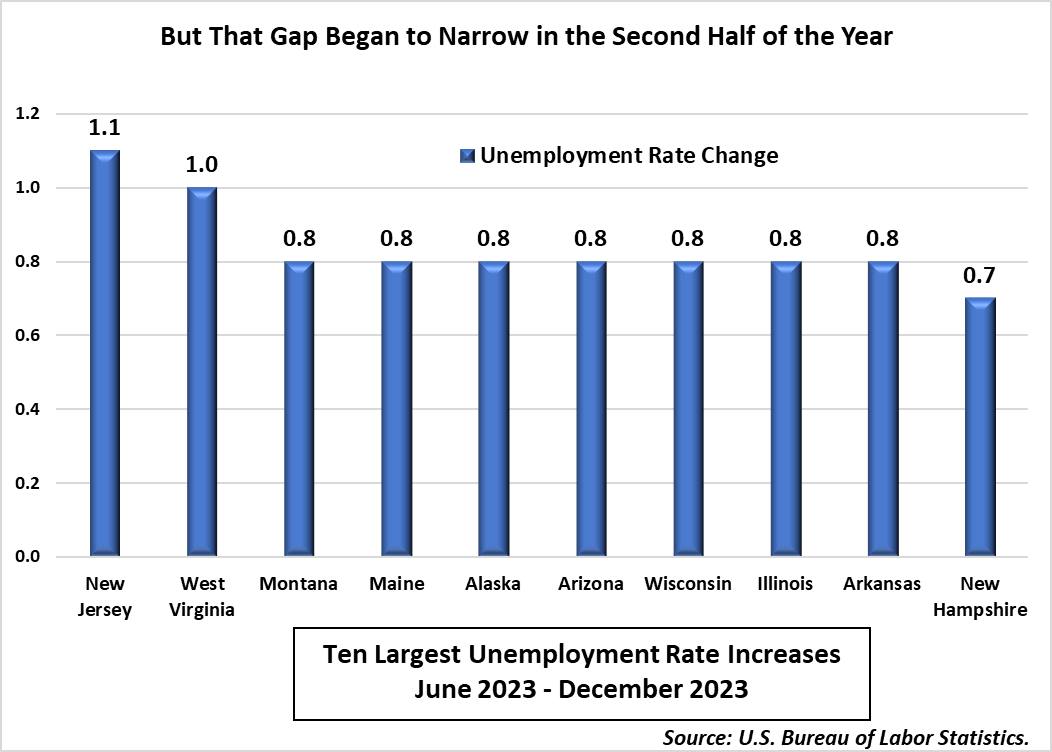
At the same time, a number of other states began to see accelerated unemployment rate growth in the second half of the year. Between June and December, 21 states experienced unemployment rate increases of 0.5 percentage points or more.
It is difficult to judge whether this portends a more widespread labor market trend heading into 2024. Each state’s labor market has its own features, and the unemployment rate can increase for different reasons in different places. Notably, of the ten states with the fastest growing unemployment rates in the second half of 2023, only in New Jersey was the increase accompanied by an overall decline in labor force. Thus, the unemployment rate increase in other states may be at least in part driven by new entrants to the labor force who have not yet found jobs. In contrast, the increase in New Jersey’s number of unemployed was accompanied by the nation’s second largest decrease in the number of employed persons (in both absolute and percentage terms).[2]
This decline together with the rapidly increasing unemployment rate in the second half of the year appears to stand in contrast to what was at first glance a relatively strong year for payroll employment in New Jersey.
NB: The payroll survey counts jobs while the household survey estimates the number of employed people.
Still riding some of the momentum driven by two years of pandemic recovery and stimulus spending, New Jersey added 69,600 jobs in 2023 – a very strong number in normal times. It is difficult to pinpoint a reason for the divergence between the rising unemployment rate and growing payroll employment, but a closer look at the payroll data does point to a slowdown across most private sector industries. Of the nearly 70,000 jobs added last year, 25% were in the public sector – most of them in teaching or other education-related local government jobs.
| Payroll Employment Change, December 2022 – December 2023 | |||
| NJ Absolute Change (thous.) |
NJ Percent Change | U.S. Percent Change | |
| Total Nonfarm | 69.6 | 1.6% | 2.0% |
| Total Private Sector | 52.4 | 1.4% | 1.8% |
| Construction | 2.3 | 1.4% | 3.1% |
| Manufacturing | 2.4 | 1.0% | 0.2% |
| Trade, Transportation, and Utilities | -0.6 | -0.1% | 0.7% |
| Information | 0.6 | 0.8% | -2.5% |
| Financial Activities | 0.0 | 0.0% | 1.0% |
| Professional and Business Services | -8.5 | -1.2% | 0.8% |
| Education and Health Services | 42.6 | 5.6% | 4.3% |
| Leisure and Hospitality | 13.9 | 3.6% | 3.4% |
| Other Services | -0.4 | -0.2% | 1.6% |
| Government | 17.2 | 2.9% | 3.1% |
NB: Absolute numbers are thousands of jobs.
Of the 52,400 private sector jobs added, the vast majority were added in two sectors – leisure and hospitality and education and health services. Leisure and hospitality employment was mostly stagnant in the second half of the year, and growth in the sector may slow further in the absence of pandemic stimulus-fueled consumer spending. Growth in health services employment will continue at the state and national level as the baby boomer generation ages. Minimal gains in the goods-producing sectors (manufacturing and construction) were more than offset by losses in professional and business services – usually a core strength for the state.
Divergent results in the Payroll and Household surveys provide a somewhat ambiguous picture of the employment situation in New Jersey. In the context of a U.S. labor market that continues to see large job gains and a steady, low unemployment rate, the sharp increase in New Jersey’s unemployment rate in 2023 is striking. At the same time, more recent increases in other states’ unemployment may indicate that New Jersey is simply an early indicator of a broader national trend. And while payroll employment growth remains strong in the state, its limited scope may point to a slowdown.
References:
[1] Note that these initial results are subject to revision when the U.S. Bureau of Labor Statistics releases its March 2023 benchmark revision for states next month. See https://www.bls.gov/web/empsit/cesbmart.htm#Summary for information on the most recent national revision or https://www.bls.gov/sae/publications/benchmark-article/annual-benchmark-article.htm for information about last year’s state benchmark revisions.
[2] The counts of employed and unemployed persons used to calculate the size of the labor force and the unemployment rate are based on a telephone survey of New Jersey households (the “Household Survey”), while payroll employment is based on a sample of New Jersey employer payrolls (the “Payroll Survey”).