
Like many parents in the United States, New Jersey parents have faced some formidable obstacles finding accessible quality childcare. This is particularly true given changes in the childcare landscape during COVID-19, as documented in our recent report. In this research brief, we document regional changes in New Jersey’s population which have led to increased challenges for parents and the states’ childcare landscape.
Census data indicate that the need for childcare in New Jersey has increased over time as proportionately more young children have parents who are employed full-time or part-time. The Census tracks this demographic as children under age six who have ‘all available parents’ in the labor force, which means that the children either live with one parent and that parent is in the labor force, or the children live with two parents and both are in the labor force. In New Jersey, the share of children under age six with all available parents in the labor force has increased, from 68.8% of children in 2010 to 72.5% in 2020.
Among all New Jersey counties, Gloucester County had the highest share of children with all available parents in the labor force in 2020 at 77.7%, followed by Atlantic (76.6%) and Hunterdon (76.4%) counties. Hunterdon County also experienced the largest increase in the share of children with all available parents in the labor force, rising 14.5 percentage points since 2010. Ocean County has the lowest share of children with all available parents in the labor force at just 61.3% in 2020, followed by Passaic (63.7%) and Middlesex (65.5%) counties.
Figure 1. Share of New Jersey children under age six with all available parents in the labor force, by county
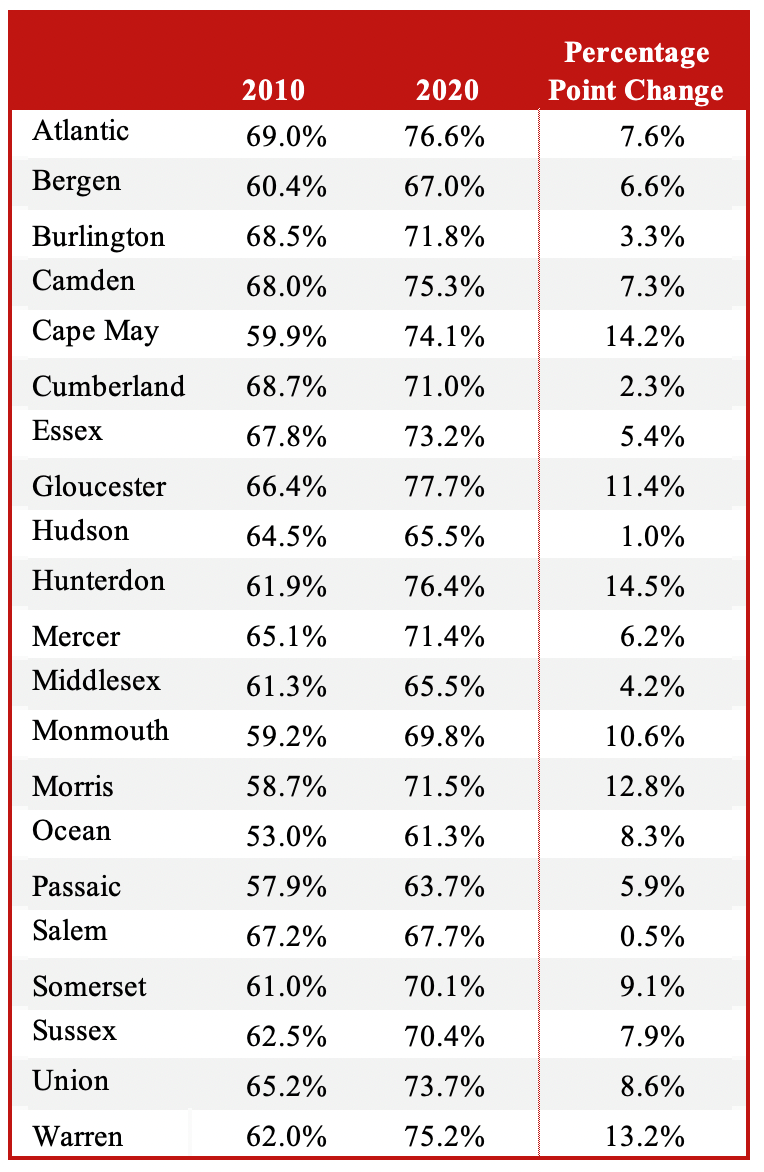
Note: Sample limited to New Jersey children under age six. Children have ‘all available parents’ in the labor force in the case where they live with one parent and that parent is in the labor force, or in the case where they live with two parents, and both are in the labor force.
Source: Authors’ analysis of American Community Survey’s table B23008, 5-year estimates.
These data suggest that an increasing proportion of New Jersey’s young children need childcare while their parents work, particularly in Cape May, Gloucester, Hunterdon, Morris, and Warren counties. Several scholars studying childcare capacity compare the number of children with all available parents in the labor force to the number of licensed childcare slots in a given region.[1] We estimate the number of licensed slots as a share of children under age six with all available parents in the labor force for each county.[2] In Middlesex County, for instance, there are an estimated 36,964 children under age 6 with all available parents in the labor force according to ACS data, but only an estimated 13,468 licensed childcare slots for children under age 6. This means that about 36% of the county’s childcare care needs are being met by licensed providers. By this rough measure, Somerset County has the highest share of care needs being met (at 59%) while Salem County has the lowest share at just 21%, as shown in Figure 2.
Figure 2. Estimated Share of Care Needs Met by Licensed Providers, 2020
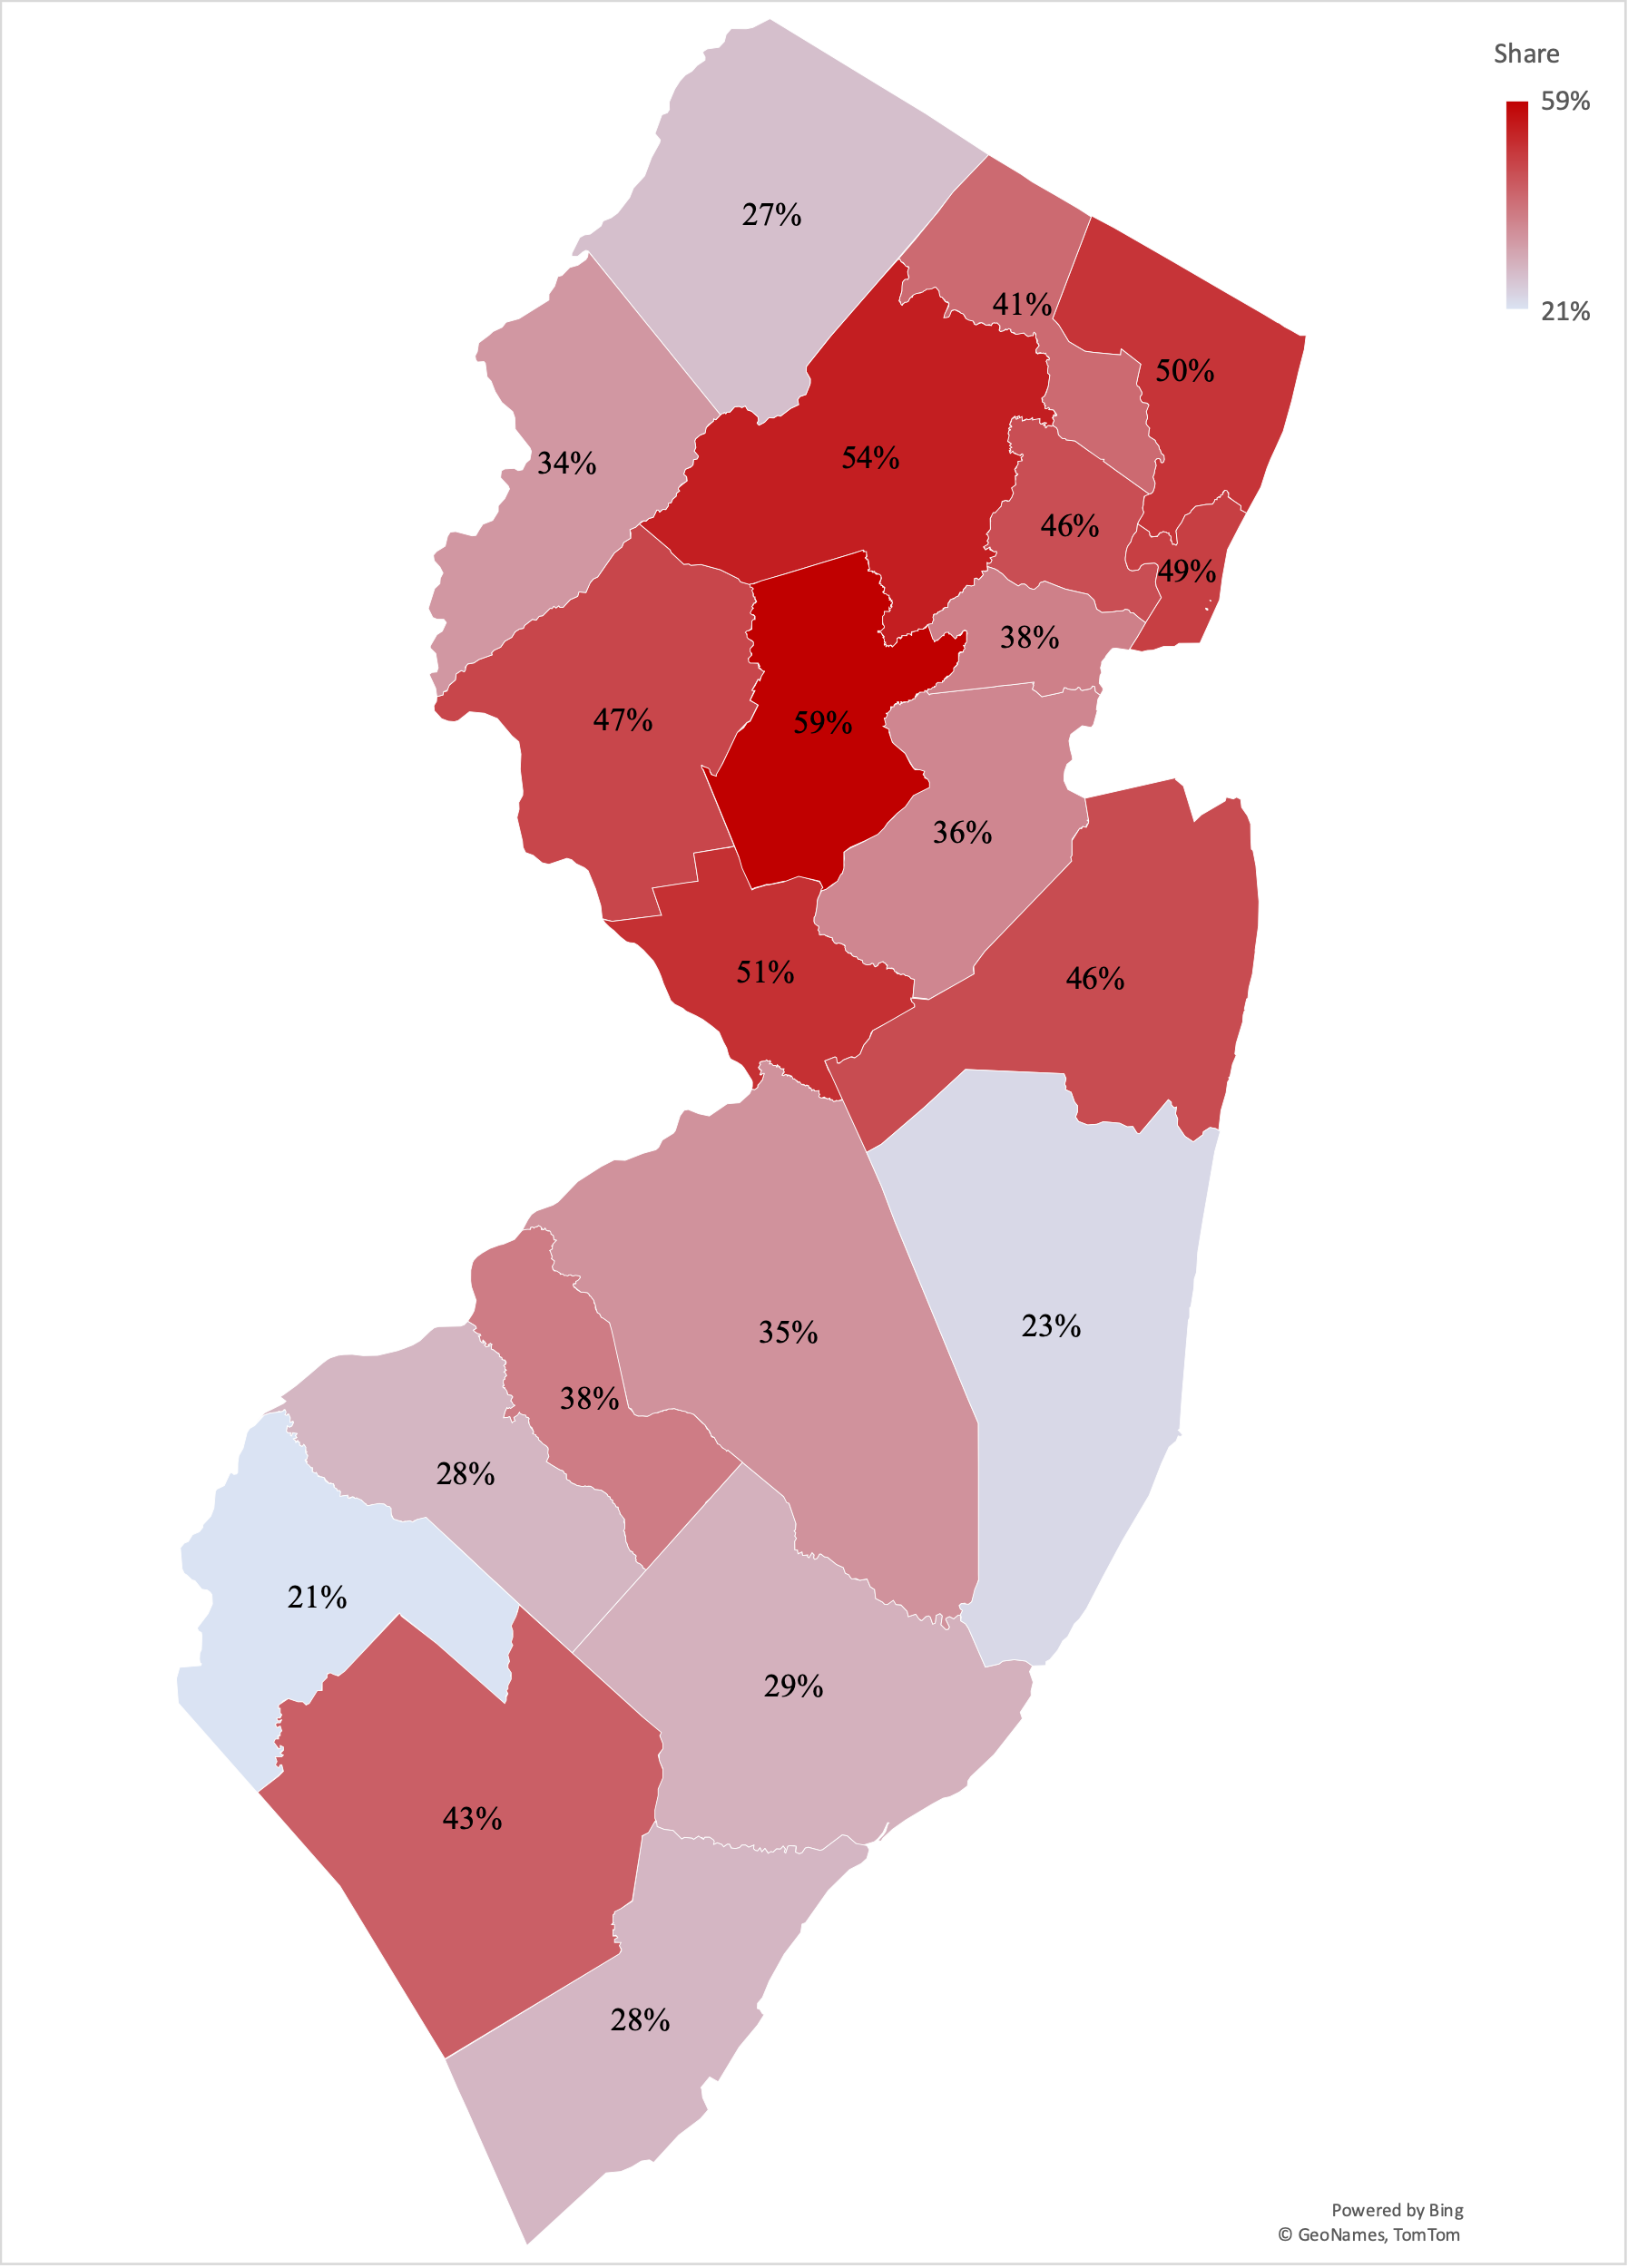
Source: Authors’ calculations using State of New Jersey Department of Human Services Division of Family Development and American Community Surveys.
Because of declines in licensed childcare capacity, many counties in New Jersey are currently facing stark shortages in care. To understand the economic consequences for parents from care shortages, we turn to Household Pulse Surveys. According to Household Pulse Surveys, which were implemented during the onset of COVID-19, from April 2021 to May 2022, an average of 24.4% of families with children in New Jersey experienced some type of inaccessibility of childcare. Low-income households, Black respondents, Hispanic respondents, LGBT parents, and single parents were more likely to indicate they had experienced inaccessible childcare over the span of the pandemic. Households with at least one child under age five also had especially high rates of inaccessibility.
Figure 3. Share of parents experiencing childcare disruptions, by demographics

Note: Sample limited to New Jersey respondents with children under age twelve. April 2021 to May 2022 (survey weeks 28 to 45).
Source: Authors’ analysis of survey-weighted Household Pulse microdata.
Many New Jersey families faced difficult decisions and adverse economic outcomes as a result of childcare disruptions, and the consequences of childcare disruptions were not experienced in the same way across all New Jersey households. Household Pulse Surveys asked parents to indicate how their work lives were affected by a childcare disruption. New Jersey parents most commonly indicated that they supervised children while working (25.5%), cut their hours (22.9%), or used paid leave (21.4%). Luckily, very few indicated they lost their job (3.5%) or left their job (8.1%). However, among respondents whose household incomes were less than $50,000, many more left or lost their jobs as a result of childcare inaccessibility. Further, a large share of Hispanic parents indicated they or someone in their household left their job as a result of a lack of childcare (16.1%). White parents and Asian, on the other hand, were more likely to indicate they were able to supervise their children while working. Households with young children faced some of the most severe economic consequences: nearly 38% of parents with children under age five indicated they cut their work hours. Unmarried parents also had less of a safety net to fall back on in terms of childcare: 4.5% of unmarried parents indicated they lost their job as a result of inaccessible childcare compared to less than one percent of married respondents.
Ultimately, without continued efforts to improve the childcare landscape in New Jersey, many families will continue to face economic hardships. Prioritizing the care economy in the coming years will be pivotal to New Jersey’s economic success, especially as the population changes in size and composition.
References:
[1] Smith, Linda, Anubhav Bagley, and Ben Wolters. 2020. “Child Care in 35 States: What we know and don’t know.” Bipartisan Policy Center. https://bipartisanpolicy.org/report/child-care-gap/
[2] For childcare centers with capacity for children older than age 6, we assume an equal number of children for each age group. This means we are likely overestimating actual capacity for children under age 6, given many centers do not have the staff to cover young children’s care needs and may therefore more heavily rely on older children to fill their licensed childcare slots. However, many slots may also be taken up by more than one child (e.g., one child uses the licensed care slot Monday through Wednesday while another child uses it Thursday and Friday).