
The Role of Nursing Homes in New Jersey’s Long-Term Care System
As New Jersey’s aging population grows, nursing homes have become a vital part of the state’s long-term care system. These facilities provide essential medical services, skilled nursing, and rehabilitative care, making it crucial to maintain high standards of care to ensure overall quality. New Jersey’s reliance on nursing homes for long-term care significantly exceeds the national average. According to the Centers for Medicare & Medicaid Services (CMS), as of August 2024, more than 42,600 residents — approximately 0.5% of the state’s population — are served by 346 Medicare-certified nursing homes. This rate places New Jersey 41% above the national average in terms of the average number of residents per day.
Effective regulation and oversight are key to ensuring high-quality care. CMS and state governments oversee Medicare- and/or Medicaid-certified nursing homes. In 2008, CMS introduced the Five-Star Quality Rating System to provide a detailed assessment of nursing home performance across various quality dimensions. These ratings, available on the Nursing Home Care Compare website, evaluate health inspection results, staffing levels, and care quality outcomes (CMS, 2024). Nursing homes in New Jersey are also assessed using this system, with the New Jersey State Government closely monitoring the ratings to uphold consistent quality standards.
Data Sources and Analysis Approach
Our project investigates the quality of nursing homes in New Jersey over the past decade and explores the associated policy implications. Specifically, we analyze trends in nursing home quality from 2013 to 2023 using data from CMS’s Nursing Home Compare and the American Community Survey (five-year estimates) from the U.S. Census Bureau. CMS’s Five-Star Quality Rating System, which ranges from one star (much below average) to five stars (much above average), evaluates nursing homes based on health deficiencies, staffing levels, and care quality. The U.S. Census Bureau data provide various county-level socioeconomic factors, and we focus on income levels in each county to uncover disparities in care quality across the state.
Combining these datasets, we first assess the performance of New Jersey nursing homes over the past decade based on their five-star ratings. We then compare New Jersey’s nursing home quality to the national average to understand how state-level quality aligns with broader benchmarks and trends. We also examine variations in nursing home quality across different counties in the state. Additionally, we explore potential inequities in long-term care by analyzing differences in nursing home services between more and less affluent areas. This involves categorizing counties based on median family income to identify disparities in care quality across different socioeconomic contexts.
Quality Ratings of New Jersey Nursing Homes: An Overview and Trend
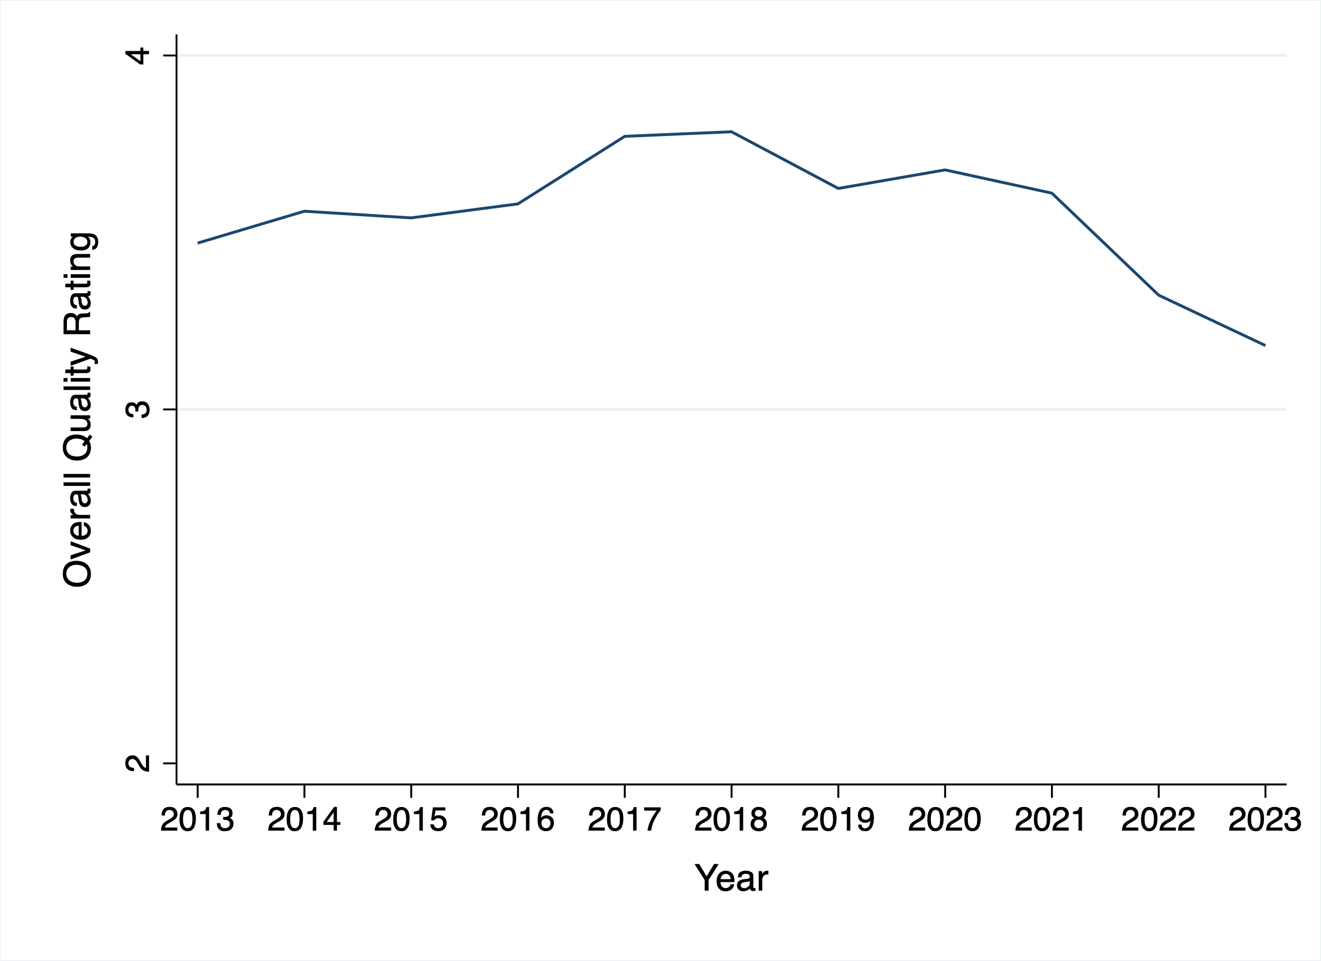
Figure 1 provides an overview of the temporal trends in the quality ratings of nursing homes in New Jersey over the past decade. On average, facilities in the state have maintained ratings between 3.2 and 3.8 out of 5 stars. The data show a trend of consistent improvement from 2013, with ratings peaking in 2018. However, from 2020 onwards, there has been a noticeable decline, culminating in a low of 3.2 stars in 2023. This decline may be linked to the impacts of the COVID-19 pandemic, which significantly affected nursing homes across the country, leading to challenges in maintaining quality care.
Figure 1. Trends in the Quality Ratings of New Jersey Nursing Homes (2013–2023)
This trend mirrors the broader pattern observed in nursing home quality ratings nationwide. As illustrated in Figure 2, quality ratings for nursing homes in New Jersey and across the U.S. have shown similar fluctuations over the past decade. However, New Jersey stands out for consistently maintaining higher-quality ratings compared to the national average. Even during the national decline in nursing home quality in 2015, facilities in New Jersey upheld their star ratings. Since then, New Jersey nursing homes have continued to demonstrate a higher level of quality compared to the national average, reflecting their resilience in maintaining care standards.
Figure 2. Quality Ratings Comparison: New Jersey and U.S. Nursing Homes (2013-2023)
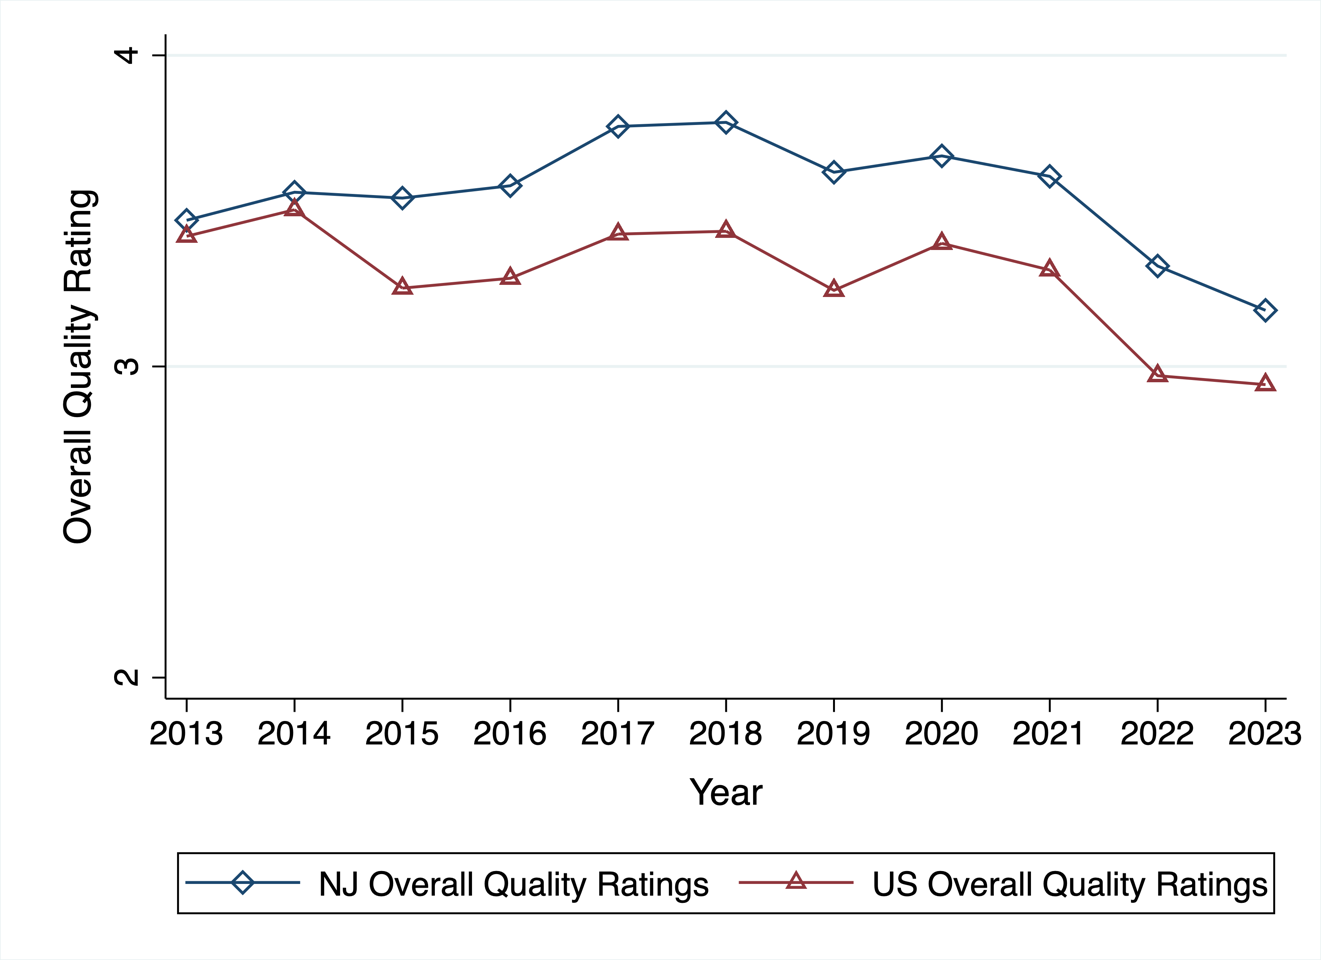
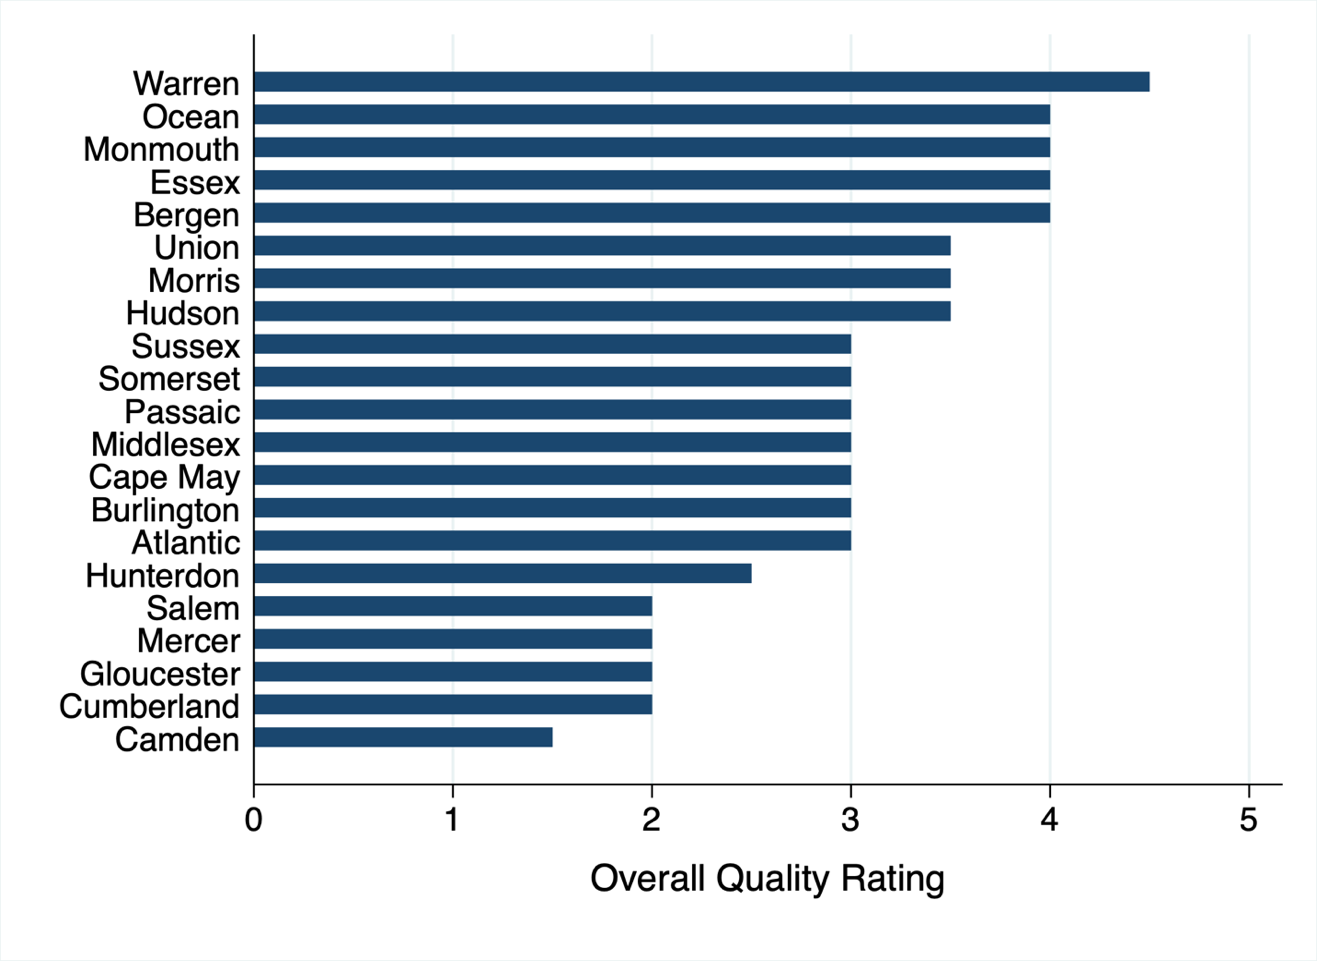
Figure 3 breaks down the quality ratings of nursing homes by county for 2023. On average, most New Jersey counties report ratings between 3 and 3.5 stars. Warren County stands out with the highest average rating of 4.5 stars, followed by Ocean, Monmouth, Essex, and Bergen Counties, each averaging 4 stars. In contrast, Salem, Mercer, Gloucester, and Cumberland Counties have lower ratings, averaging around 2 stars. Camden County reports the lowest average rating at just 1.5 stars. These variations highlight significant disparities in the quality of nursing home care across different counties in New Jersey.
Figure 3. Quality Ratings of Nursing Homes in New Jersey by County in 2023
Next, we explore how nursing home quality varies across different economic statuses within the community. To conduct this analysis, New Jersey counties are classified as more or less affluent based on each year’s median family income.[1] Counties above the median are categorized as ‘above median family income,’ while those below are classified as ‘below median family income.’ Our data show that nursing homes in more affluent counties consistently achieved higher ratings, averaging 4 stars or more from 2014 to 2021, though ratings declined to 3 stars in 2022. Conversely, nursing homes in less affluent counties exhibited fluctuating ratings between 3 and 4 stars, often falling below the state average. This suggests a correlation between economic status and long-term care quality, with more affluent areas benefiting from higher-rated facilities.
Figure 4. Quality Ratings of Nursing Homes in New Jersey by Median Family Income Level (2013-2022)

Nursing homes are a vital part of New Jersey’s long-term care system, serving a significant portion of the population. While quality ratings have seen a recent decline, likely due to the COVID-19 pandemic, New Jersey facilities generally uphold higher standards than the national average. During the pandemic, the state implemented several aggressive measures to protect residents and staff. Yet, our analysis reveals notable disparities in nursing home quality across counties and economic statuses, highlighting the need for targeted policy interventions. Addressing these inequities requires focused efforts on improving care in lower-rated facilities and enhancing support for low-income areas. It would be prudent for the New Jersey Department of Health and the COVID-19 Pandemic Task Force on Racial and Health Disparities to consider these findings to promote more consistent care quality statewide, particularly in lower-rated facilities and low-income areas.
Miyeon Song is an assistant professor at the School of Public Affairs and Administration at Rutgers-Newark, Seungho An is an assistant professor at the School of Government and Public Policy at the University of Arizona, and Jinah Yoo is a doctoral student at the School of Public Affairs and Administration at Rutgers-Newark.
References:
[1] Income data for 2023 are unavailable at the time of this analysis. Information regarding the income data used in Figure 4 can be downloaded here.