
In this fourth blog post on our research into corporate and investor ownership of New Jersey’s one- to four-unit residential properties, we present some preliminary findings from our analysis of property ownership from 2012 to 2022. Investor ownership, particularly by corporate entities, has become a growing concern for housing advocates and policymakers. Research suggests that corporate ownership is often associated with reduced opportunities for affordable homeownership and increased pressures on tenants. To address these concerns, we are analyzing statewide patterns of investor ownership using historical tax parcel data.
Statewide, roughly 80% of one- to four-unit properties were likely owner-occupied in 2022, a rate that has remained stable since 2012. While the overall share of investor-owned properties (18%) did not change significantly over the decade, corporate investors accounted for a larger share in 2022—nearly 4% of all properties or roughly 20% of all investor-owned homes. Other categories of ownership included properties owned by banks, nonprofits, and trusts.
At the county scale, we observed variation reflecting the diverse housing markets across the state. For instance, Cape May County had the highest share of properties with tax bills sent to an offsite address (over 50%), likely reflecting the prevalence of vacation homes and rentals in seaside communities. Meanwhile, Hudson County recorded the highest rate of corporate ownership in 2022 at 8%, likely influenced by its proximity to New York City and investor interest in hot housing markets with high rental returns. Overall, county-level ownership rates were generally stable over time, with single-digit percentage-point changes in ownership categories.
Investor ownership patterns became more pronounced at the municipal scale between 2012 and 2022, particularly in some historical urban centers and areas with historically softer housing markets. Trenton was the top municipality in terms of corporate ownership in 2022 at 25%, a substantial increase from 8% in 2012. This increase coincided with a significant decline in owner-occupancy, which fell from 55% to 42% over the same period (see Figure 1). Similar trends were observed in municipalities like Asbury Park in Monmouth County and Penns Grove in Salem County, where corporate and other investor ownership rates are higher than the statewide average.
Our ongoing analysis aims to understand the geographic patterns and contextual factors driving these trends in investor ownership. For example, we are examining how neighborhood-level characteristics, such as rates of high-cost lending and foreclosures, have contributed to the availability of properties for investor acquisition. Neighborhood-scale analysis is critical, as it often reveals substantial variation that municipal rates can mask. In our final report, we will dive deeper into the neighborhood-level dynamics of investor ownership and their implications for housing equity and affordability.
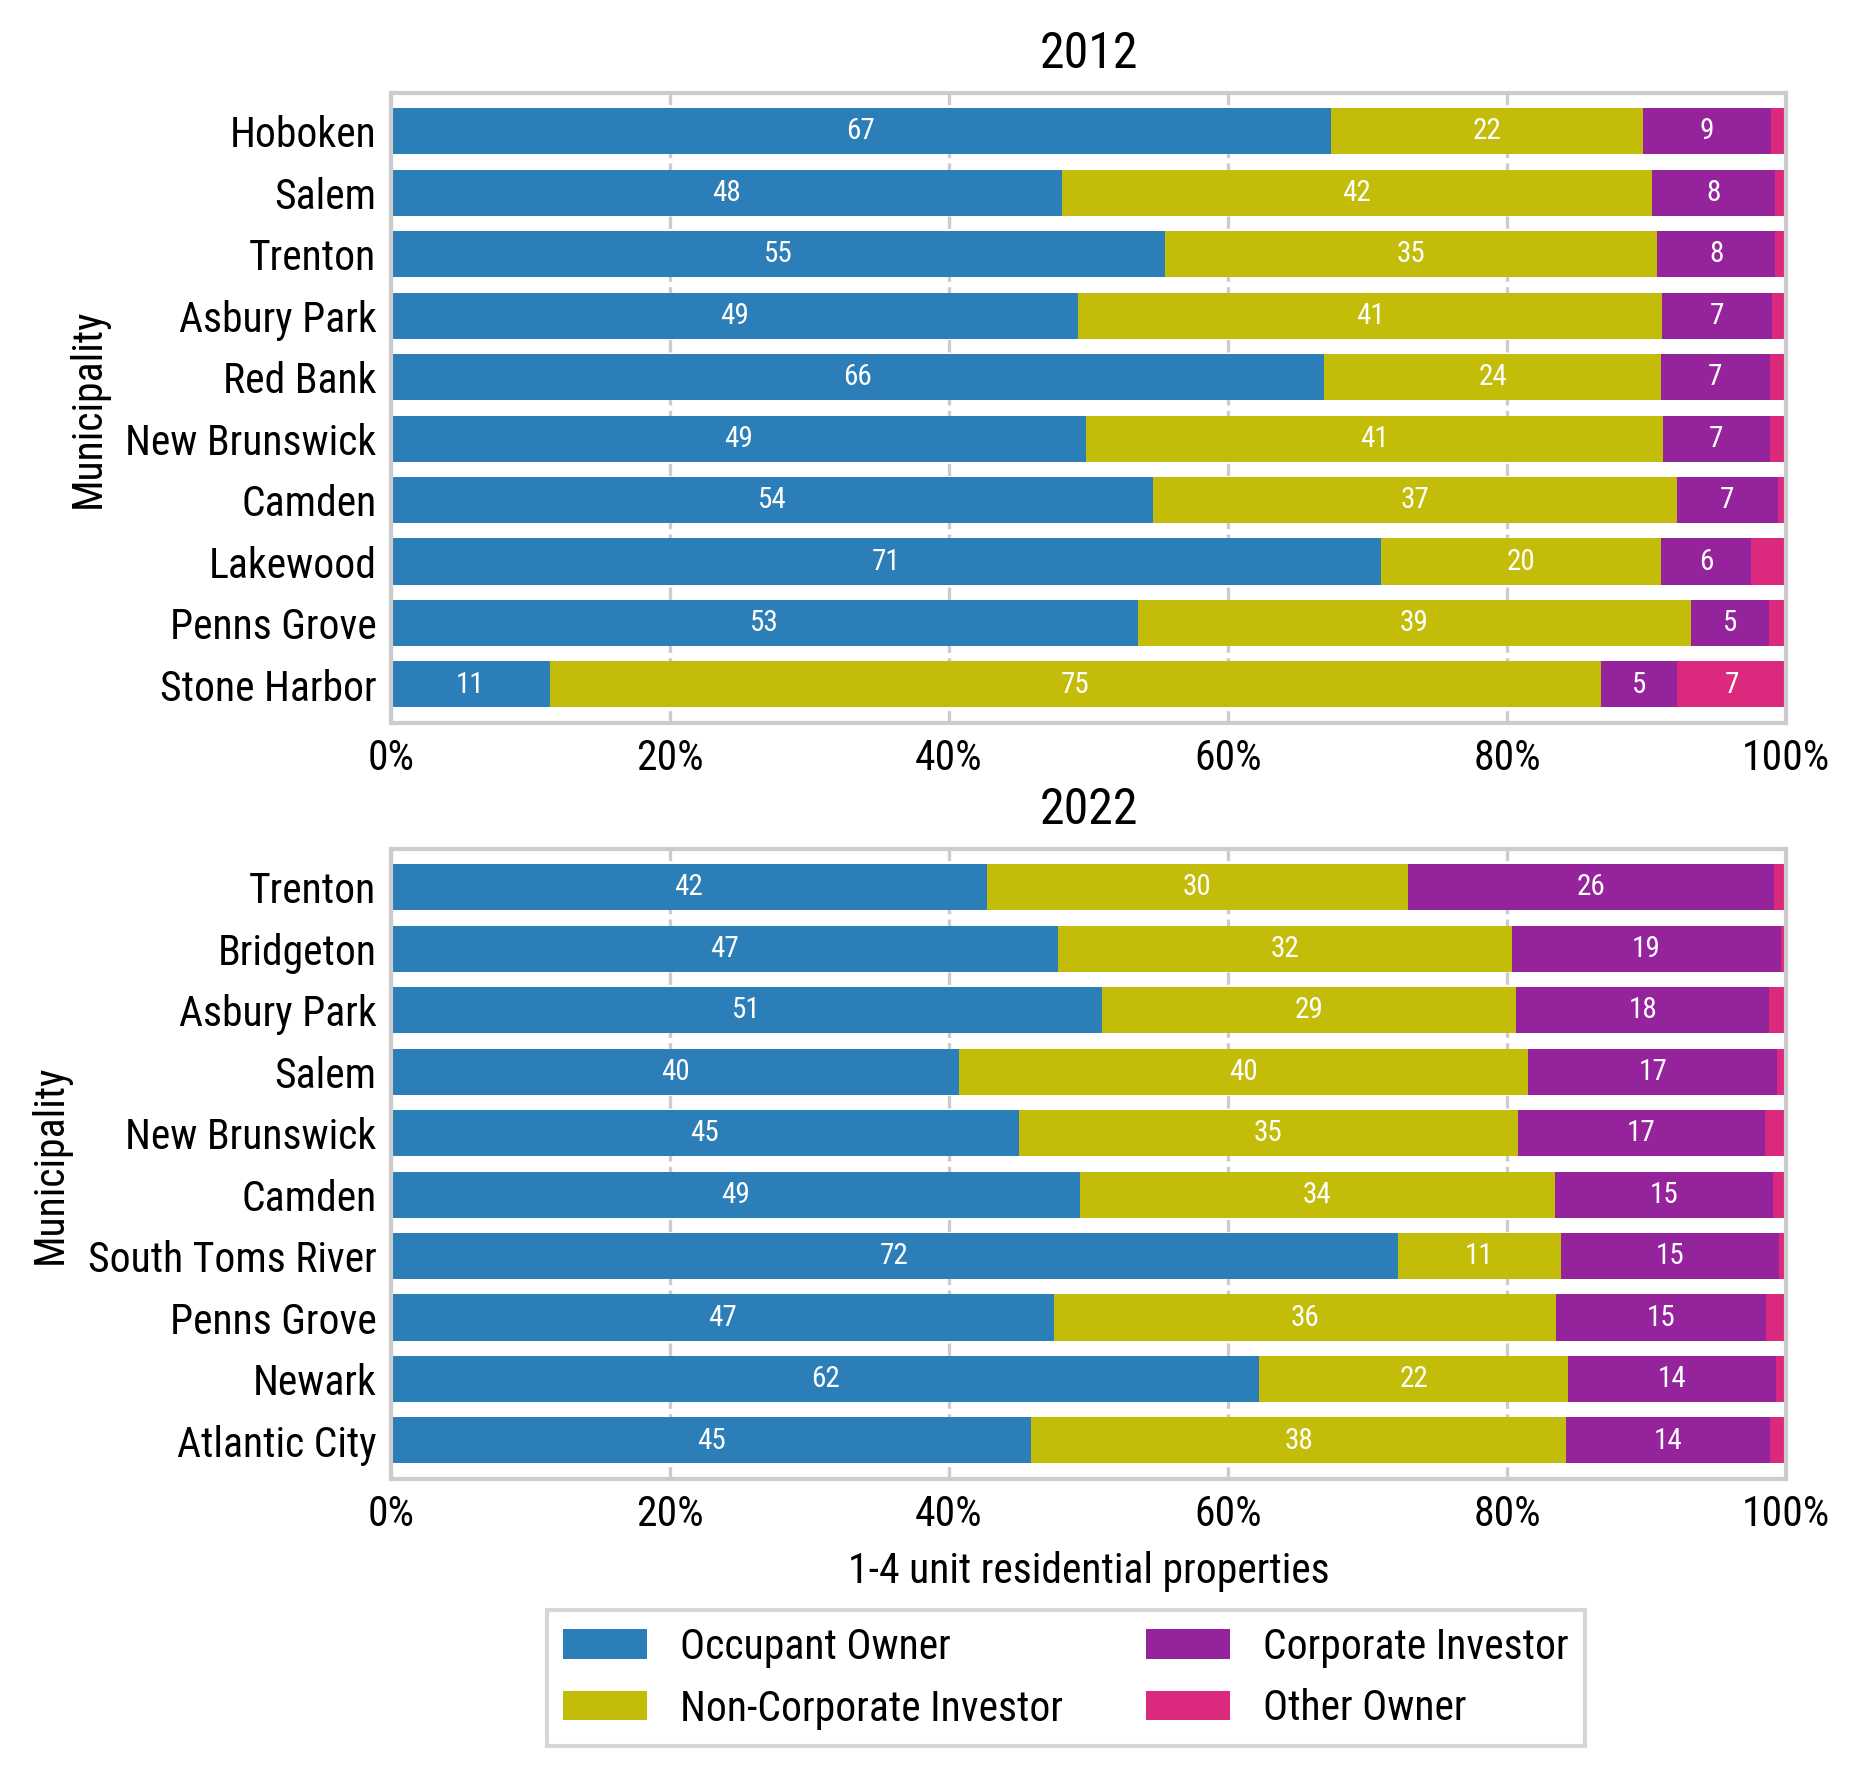
Figure 1: Top 10 municipalities with at least 1,000 one- to four-unit residential properties ranked by rate of corporate-ownership (in purple), 2012 and 2022.
Note: Excludes condominium properties. “Other Owner” includes banks, non-profits, and trusts. Source: Author’s calculations of New Jersey MOD-IV historical database.