
In our previous post, we outlined a looming economic paradox: the AI revolution, while technologically dazzling, runs on an astonishing amount of physical power. We know that electricity prices are spiking across the country, and there is strong evidence that the voracious energy appetite of data centers is a primary driver (Luccioni & Jernite, 2025). We know that everyday households are likely subsidizing the most profitable companies in the world.
But knowing that it is happening is different from measuring exactly where and by how much.
Over the last month, our team has moved from the “why” to the “how.” We are transitioning from high-level economic modeling to a boots-on-the-ground investigation. To do this, we had to solve two major problems: finding data centers that don’t want to be found and building a research framework robust enough to measure their impact on your electricity bills.
Mapping the Invisible Infrastructure
One of the greatest challenges in studying the energy impact of AI is that the infrastructure is often opaque. Data center development is difficult to track; companies frequently redact information regarding ownership, energy consumption, and infrastructure under the guise of proprietary business interests. If we cannot pinpoint exactly where the heavy loads are, we cannot measure their localized impact on utility rates.
To solve this, we adopted a forensic approach inspired by recent investigative journalism. Since we couldn’t find the data centers directly, we tracked their fail-safes: EPA permits for backup diesel generators. Because these facilities demand 100% uptime, they rely on massive generator banks to stay online during grid failures. By filtering these permits to isolate facilities with a capacity of over 5,000 MWh/year, we were able to reverse-engineer a map of the state’s most energy-intensive “hot spots.”
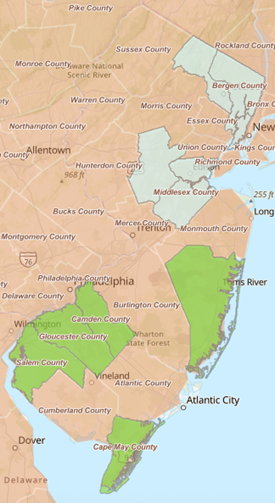
Based on our analysis of backup generator permits, we have identified a distinct geographic split in New Jersey’s digital infrastructure. Our ‘Exposed’ cohort targets (highlighted in our map in gray) Bergen, Hudson, Middlesex, Passaic, and Somerset counties—northern and central regions that host the highest concentration of data center activity. To isolate the economic impact of these facilities, we are comparing households in these areas against a ‘Control’ group situated primarily in the southern and coastal parts of the state (highlighted in our map in green): Camden, Cape May, Gloucester, Ocean, and Salem counties. By recruiting participants from these specific low-density zones where data center presence is minimal, we can establish a reliable baseline for residential electricity costs, allowing us to accurately measure the price premium potentially driven by AI infrastructure in the exposed regions. By recruiting participants from both zones, we can conduct a comparative analysis to see if the “AI tax” on electricity bills is distributed evenly, or if communities living in the shadow of the cloud are paying a steeper price.
A New Approach to Data Collection
Finding the data centers was step one. Getting the actual electricity bills is step two. We are launching a targeted recruitment campaign using both Prolific survey data and social media to reach 500 to 750 households specifically within our identified “Exposed” and “Control” counties. By collecting 12 to 24 months of detailed utility invoices from these regions, we will move beyond broad averages to capture the granular signal of rising costs amidst the noise of daily usage. Participants will upload their data via our secure project portal, and a subset will be selected for qualitative interviews to understand the human side of these rising costs.
The “Arms Race” vs. The Grid
The urgency of this work has only grown since our project began. New Jersey is currently investing heavily in AI infrastructure, with a $500 million bid to become a global leader in the field (Hoover, 2024). While this ambition promises economic growth, it clashes with the physical reality of our 20th-century power grid.
The International Energy Agency projects that electricity demand from this sector will more than double globally by 2026 (IEA, 2025). This isn’t a gradual incline; it is a vertical shock. This concentrated, near-instantaneous new load presents a novel threat to grid stability, with some experts already warning of potential rolling blackouts on the East Coast as the grid strains to keep up (Rascius, 2026).
Furthermore, recent research on the “e-waste” and energy challenges of generative AI highlights that this is an “arms race” for computing power (Wang et al., 2024). As companies rush to build bigger models, they build bigger data centers. And as they build bigger data centers, the “fixed costs” of grid reinforcement such as new transmission lines, substations, and resilience upgrades, are often passed down to residential ratepayers (Wiser et al., 2025).
Next Steps
We are currently finalizing our “Exposed” vs. “Control” county lists and will begin active recruitment on Prolific shortly. By moving from theoretical models to empirical, bottom-up analysis, we aim to provide New Jersey policymakers with the missing metric: the actual dollar cost of AI on the family budget.
We look forward to sharing our preliminary findings in the coming months.
References
- Hoover, A. (2024). New Jersey’s $500 Million Bid to Become an AI Epicenter. Wired.
- (2025). Demand: Global electricity use to grow strongly in 2025 and 2026 – Electricity Mid-Year Update 2025. International Energy Agency.
- Luccioni, S., & Jernite, Y. (2025). How Your Utility Bills Are Subsidizing Power-Hungry AI. Tech Policy Press.
- Rascius, B. (2026). East coast could see rolling blackouts as data centers strain the electric grid. The Independent.
- Saul, J., Nicoletti, L., Pogkas, D., Bass, D., & Malik, N. (2025). AI Data Centers Are Sending Power Bills Soaring. Bloomberg.
- Wang, P., Zhang, L.-Y., Tzachor, A., & Chen, W.-Q. (2024). E-waste challenges of generative artificial intelligence. Nature Computational Science, 4(11), 818–823.
- Wiser, R., O’Shaughnessy, E., Barbose, G., Cappers, P., & Gorman, W. (2025). Factors influencing recent trends in retail electricity prices in the United States. The Electricity Journal, 38(4).