
Supporting New Jersey residents in returning to college after leaving without a credential has been an increasing focus of the state’s recent efforts[1]. A newly released report by the National Student Clearing House Research Center offers updated insights into the status of individuals with some college but no credential in New Jersey and across the nation during the 2023-2024 academic year[2].
In New Jersey, some college, no credential (SCNC) population[3] totaled around 840,500 students, placing the state 12th among the 50 states and Washington, DC. Table 1 summarizes SCNC population data for the nation, New Jersey, and the five states with the highest and lowest totals. California reported the highest number of SCNC individuals (over 7 million), while Vermont and Washington, DC had the smallest populations (around 74,500 and 42,000, respectively).
During the 2023–2024 academic year, over 757,000 working-age individuals (under 65) in New Jersey were part of the SCNC population, a 1.9% increase from the previous year. These individuals made up 2% of the national SCNC population under 65, which rose by 2.2% compared to the previous year.
Among New Jersey’s SCNC population under 65, 4.8% were students who had recently left their education between January 2022 and July 2023 and were newly identified as SCNC in 2023–2024. Additionally, about 60,000 individuals – 7.9% of the SCNC population under 65—had completed at least two years of full-time equivalent enrollment in the past decade, positioning them as potential degree completers.
Around 17,400 SCNC individuals who last enrolled in New Jersey re-enrolled in postsecondary institutions nationwide in the 2023–2024 academic year, yielding a re-enrollment rate of 2.3%. Of those who re-enrolled in New Jersey, 4.4% earned their first credential in the same year. Both metrics are slightly below the national rates of 2.7% and 4.7%, respectively. The perseverance rate, defined as the percentage of re-enrollees in the previous year who returned in 2023–2024, was 58.7%, matching the national rate.
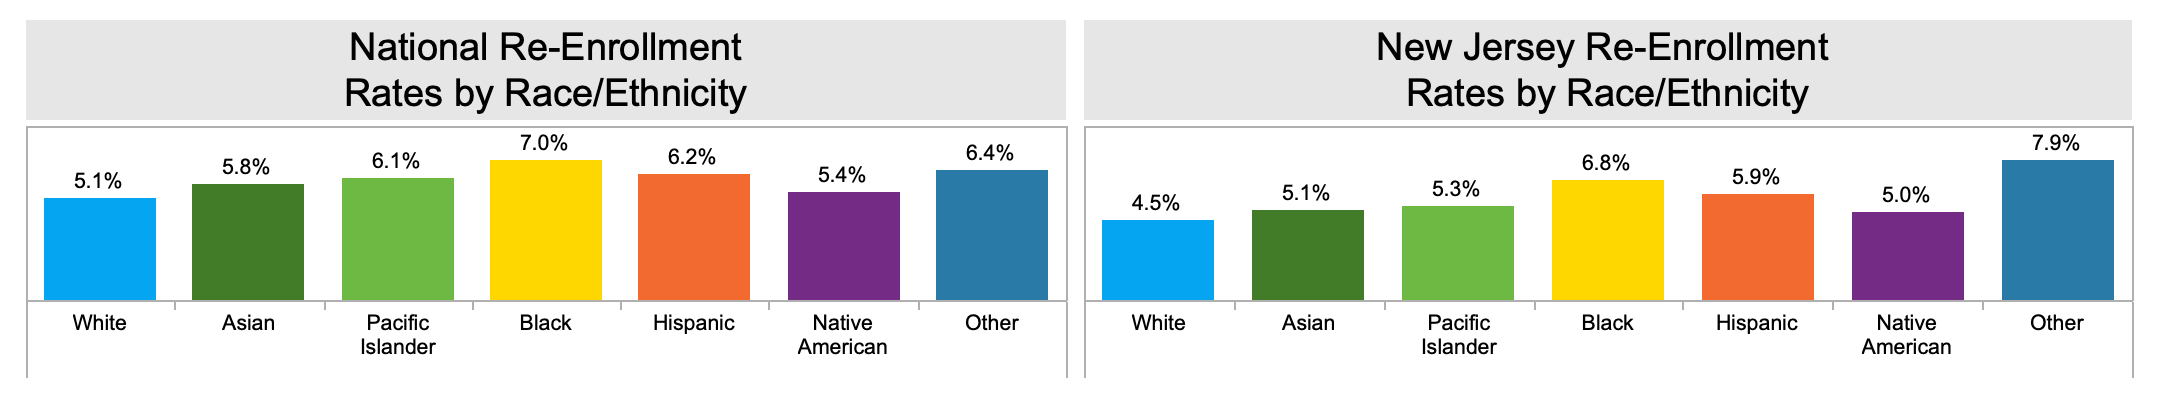
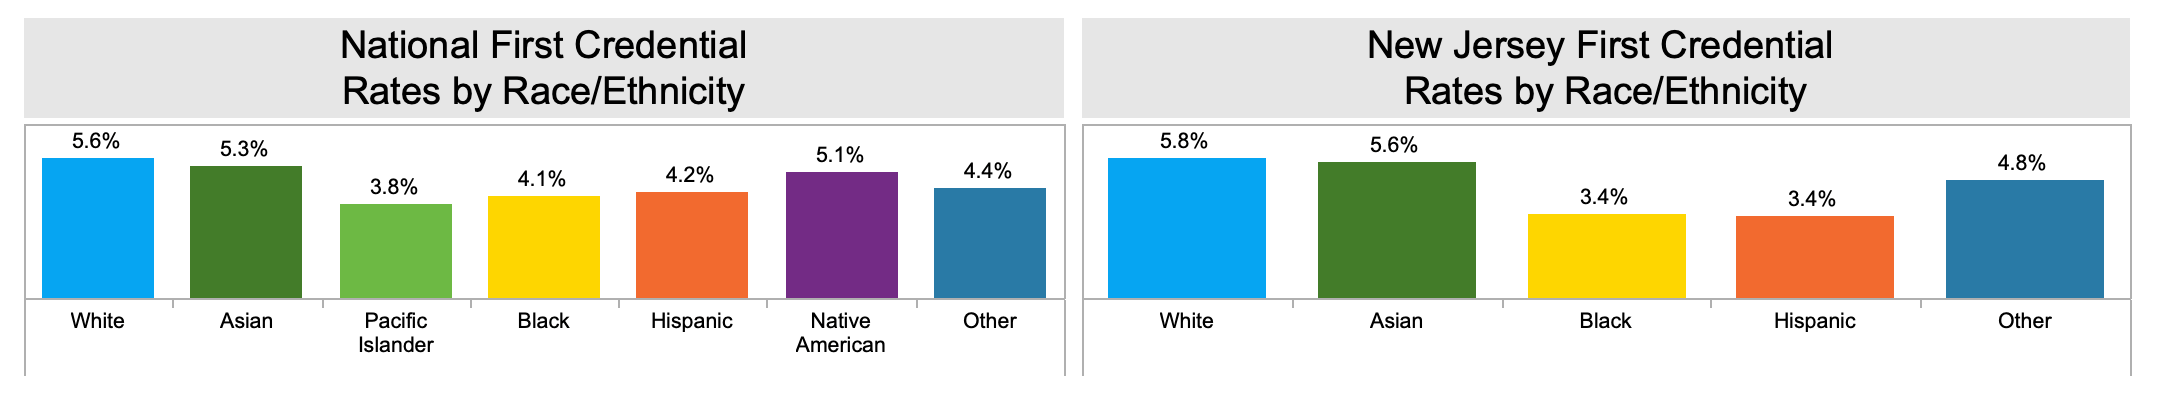
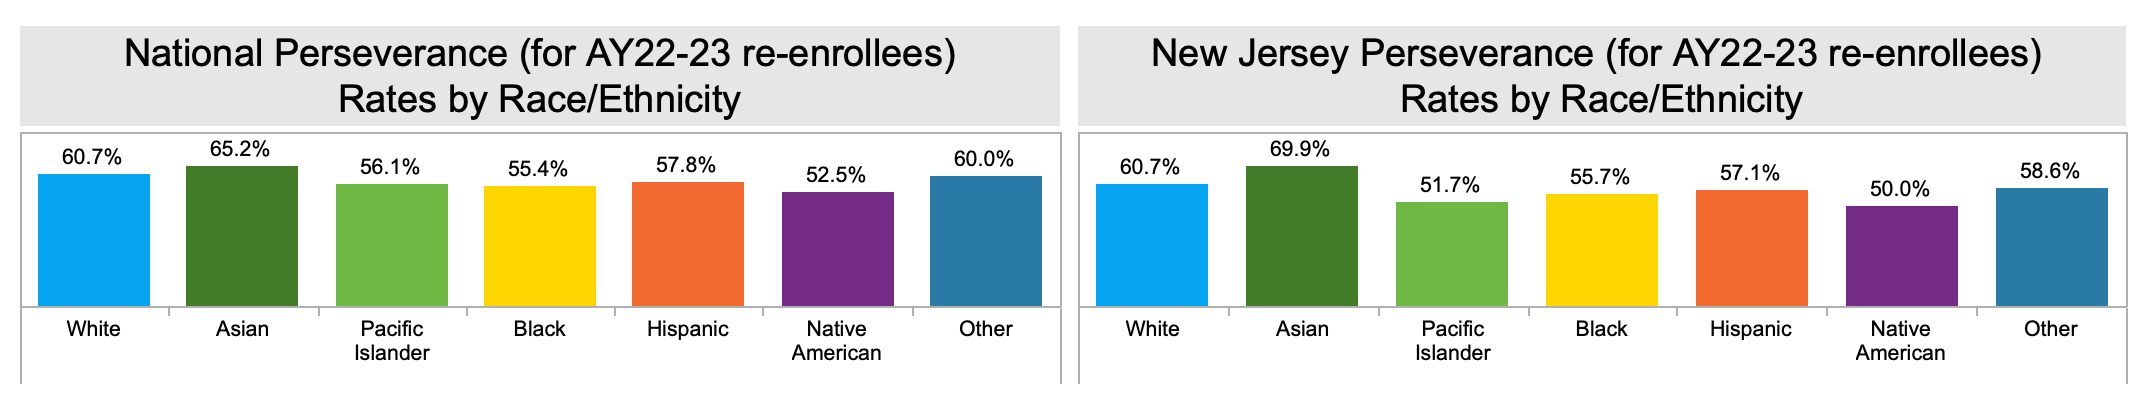
Based on the limited data available by race/ethnicity[4], re-enrollment rates were higher among Black (6.8%) and Hispanic (5.9%) SCNC individuals than among White (4.5%) and Asian (5.1%) students (Figure 1). However, credential attainment and perseverance rates were higher among White and Asian students. Specifically, first credential rates were 3.4% for both Black and Hispanic students, compared to 5.8% for White and 5.6% for Asian students. Perseverance rates showed a similar trend: 55.7% for Black and 57.1% for Hispanic students, versus 60.7% for White and 69.9% for Asian students. These disparities also reflect national patterns.
Figure 1. SCNC Student Outcomes by Race/Ethnicity in 2023-2024 Academic Year
Source: National Student Clearinghouse Research Center. (2025). Some College, No Credential Student Outcomes – 2025 Report for the Nation and the States https://nscresearchcenter.org/some-college-no-credential/
Table 1. SCNC Students in New Jersey and Other States in 2023-2024 Academic Year
| Ranking by Total SCNC (largest to smallest) | State | Total SCNC (All Ages) |
SCNC Under 65 |
Recent Stopouts as a Share of SCNC Under 65 | Potential Completers as a Share of SCNC Under 65 | 1-Year Change in SCNC Under 65 Counts | 1-Year Percent Change in SCNC Under 65 Counts | Re-Enrollment Rate* | First Year Credential Earning Rate | Perseverance Rate |
| U.S. Total | 43,098,820 | 37,639,602 | 5.6% | 7.2% | 799,160 | 2.2% | 2.7% | 4.7% | 58.7% | |
| 1 | California | 7,066,226 | 5,941,080 | 5.8% | 7.0% | 110,467 | 1.9% | 2.9% | 2.5% | 53.5% |
| 2 | Texas | 2,832,320 | 2,642,574 | 6.6% | 7.8% | 86,030 | 3.4% | 3.1% | 4.4% | 59.0% |
| 3 | New York | 2,136,652 | 1,936,325 | 4.7% | 8.2% | 42,868 | 2.3% | 2.2% | 5.3% | 62.8% |
| 4 | Illinois | 2,030,908 | 1,648,560 | 4.1% | 4.7% | 17,085 | 1.0% | 2.0% | 9.6% | 52.9% |
| 5 | Florida | 1,791,304 | 1,606,236 | 6.2% | 7.1% | 45,103 | 2.9% | 2.8% | 6.1% | 59.3% |
| 12 | New Jersey | 840,502 | 757,282 | 4.8% | 7.9% | 14,263 | 1.9% | 2.3% | 4.4% | 58.7% |
| 47 | North Dakota | 80,780 | 70,040 | 5.7% | 9.1% | 1,710 | 2.5% | 2.1% | 5.3% | 60.8% |
| 48 | Delaware | 78,250 | 74,167 | 8.8% | 10.0% | 4,103 | 5.9% | 3.5% | 4.6% | 59.8% |
| 49 | South Dakota | 75,301 | 67,808 | 5.7% | 8.7% | 1,949 | 3.0% | 2.3% | 5.7% | 59.5% |
| 50 | Vermont | 74,549 | 63,550 | 5.9% | 7.5% | 4,300 | 7.3% | 2.6% | 3.2% | 55.6% |
| 51 | District of Columbia | 41,911 | 36,706 | 5.7% | 10.9% | 1,191 | 3.4% | 2.7% | 4.9% | 70.7% |
Notes: * based on total SCNC population under 65
– Stopout period: 1/1/2022-7/31/2023
– Perseverance: SCNC students who re-enrolled in 2022-2023 and persevered into 2023-2024
Source: National Student Clearinghouse Research Center. (2025). Some College, No Credential Student Outcomes – 2025 Report for the Nation and the States https://nscresearchcenter.org/some-college-no-credential/
References:
[1] Office of the Secretary of Higher Education. Statewide “Some College, No Degree” Initiative. https://nj.gov/highereducation/somecollegenodegree.shtml
[2] National Student Clearing House Research Center. (2025). Some College, No Credential Student Outcomes – 2025 Report for the Nation and the States https://nscresearchcenter.org/some-college-no-credential/
[3] “SCNC students identified in the Clearinghouse data as of July 2023 are those who had at least one postsecondary enrollment record after January 1, 1993 (the beginning of the Clearinghouse database), with a period of stop-out defined as having had no enrollment between January 1, 2022, and July 31, 2023 (“the stopout period”, which represents roughly three consecutive academic terms), and no degree or certificate awarded as of July 31, 2023. This resulted in 43.1 million students.” (National Student Clearing House Research Center. (2025). Some College, No Credential Student Outcomes – 2025 Report for the Nation and the States https://nscresearchcenter.org/some-college-no-credential/)
[4] Race/ethnicity findings should be interpreted with caution, as the share of SCNC students currently under 65 with missing racial/ethnic information is 61.3 percent. Due to significantly lower data coverage in earlier years, this report limits analyses of race/ethnicity distributions and re-enrollment rates to students who entered college in 2013 or later.