
The New York Fed Consumer Credit Panel, based on Equifax data, provides insights into consumer credit trends, both nationally and by state. More specifically, the survey computes national and regional aggregate measures of individual- and household-level credit balances, and delinquencies by product type. The Consumer Credit Panel also provides new insights into the extent and nature of heterogeneity of debt and delinquencies across individuals and households. This discussion focuses on National versus New Jersey trends. With a 289,000 quarterly sample, it offers fresh insights into New Jersey developments versus the national average and other states.
Given the paucity of incoming data, the 2025Q3 Report on Household Debt and Credit (released in early November 2025) offers some timely comparisons. On balance, the current data is not alarming for New Jersey, but the upticks in delinquencies raise some red flags. The following trends, based on non-seasonally adjusted data, are seen in the report:
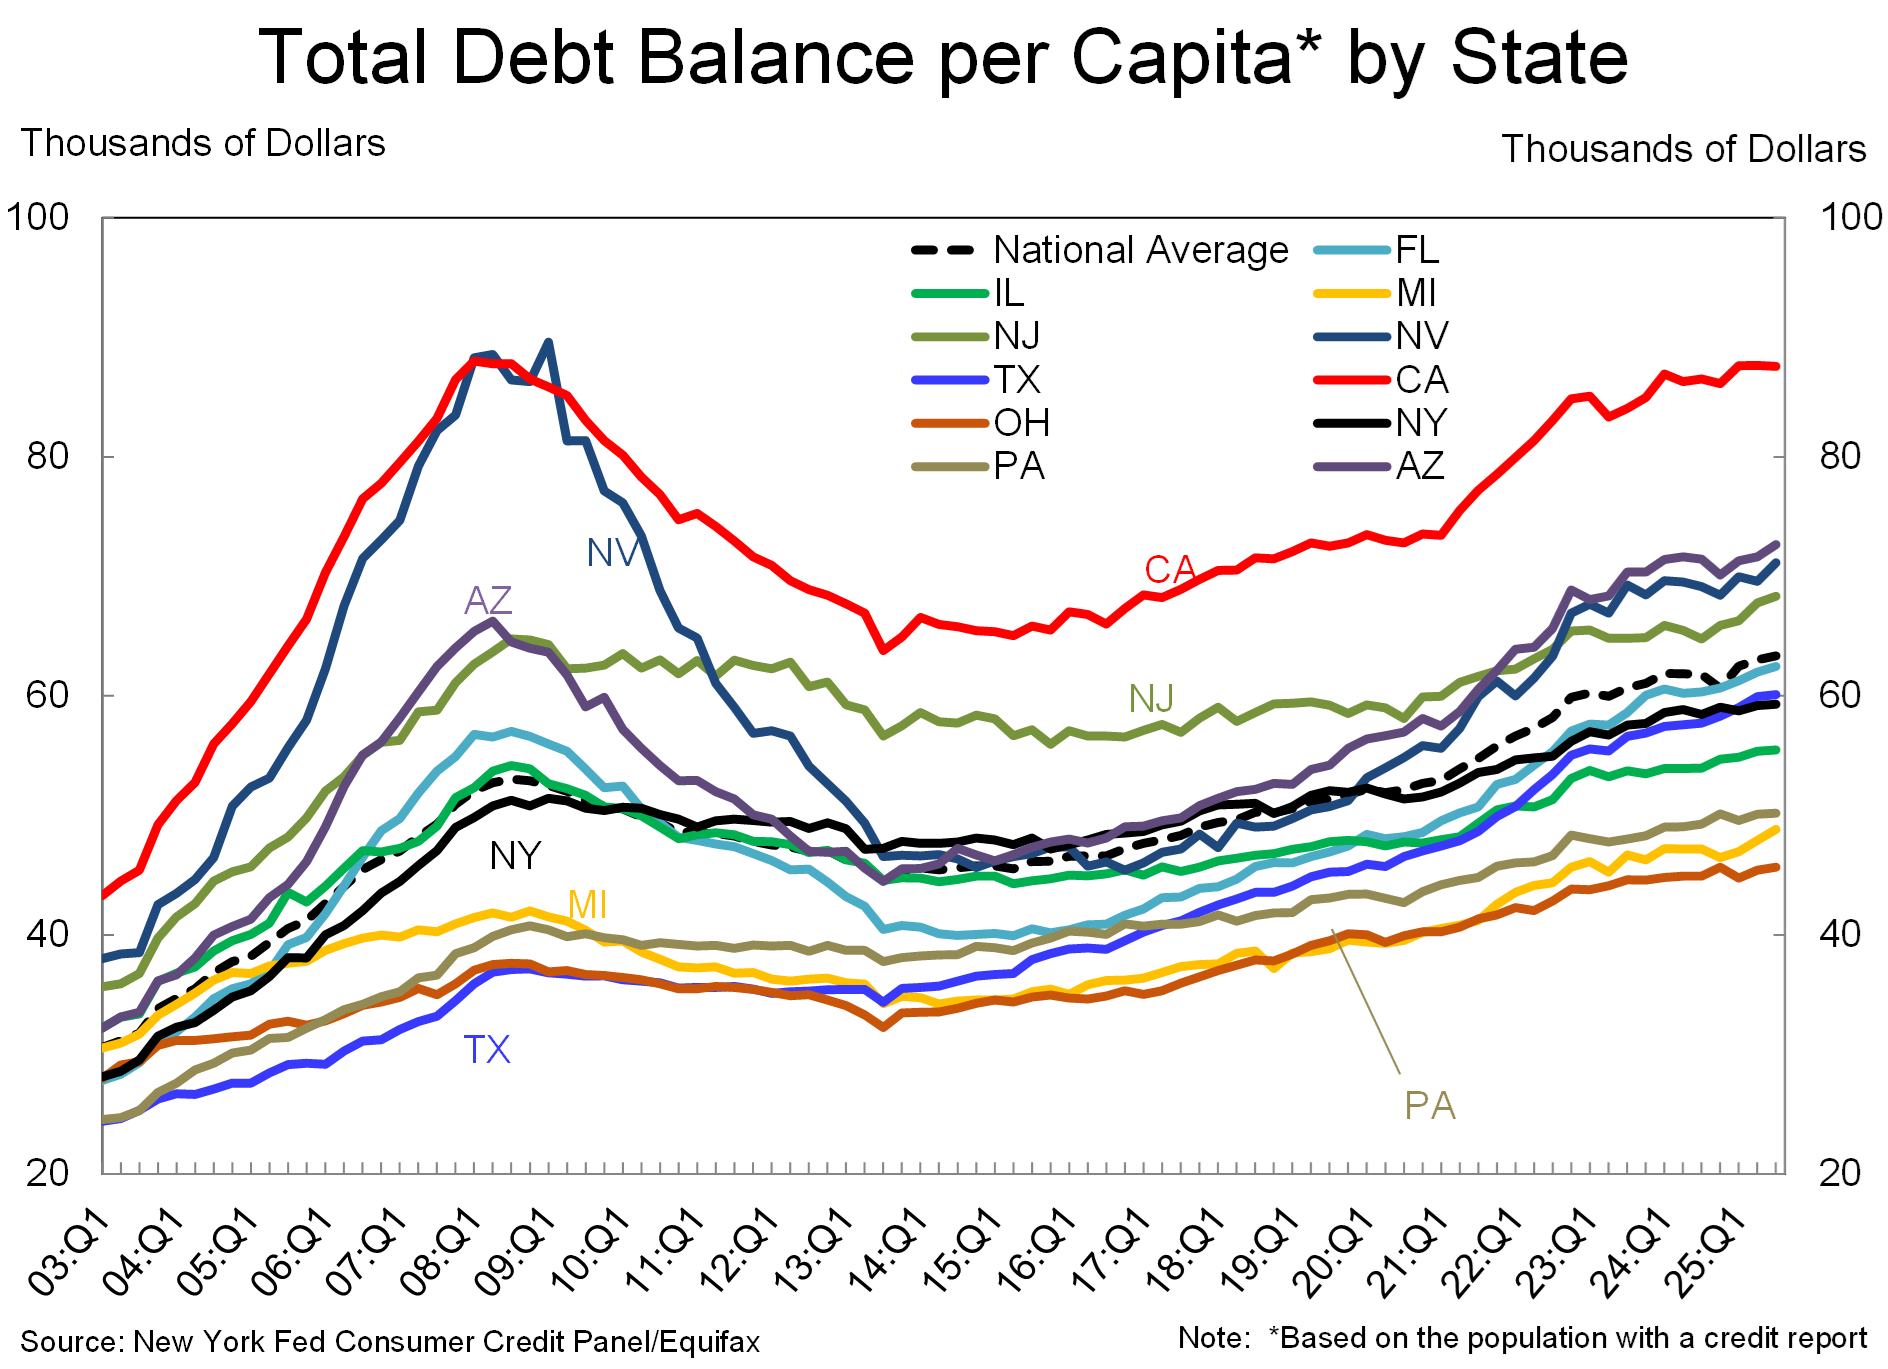
- New Jersey’s total per capita debt balance increased to $68,340 in 2025Q3, a 0.8% increase over 2025Q2, and a 5.5% increase versus 2024Q3. The yearly increase is the highest among reported states and above the national average of 2.5%. However, California topped the per capita debt balance at $87,570. The earlier dip in per capita debt balances can be attributed to the stronger economy and later by pandemic era payments, which held up household balances to some extent. However, indebtedness rapidly increased since 2022.
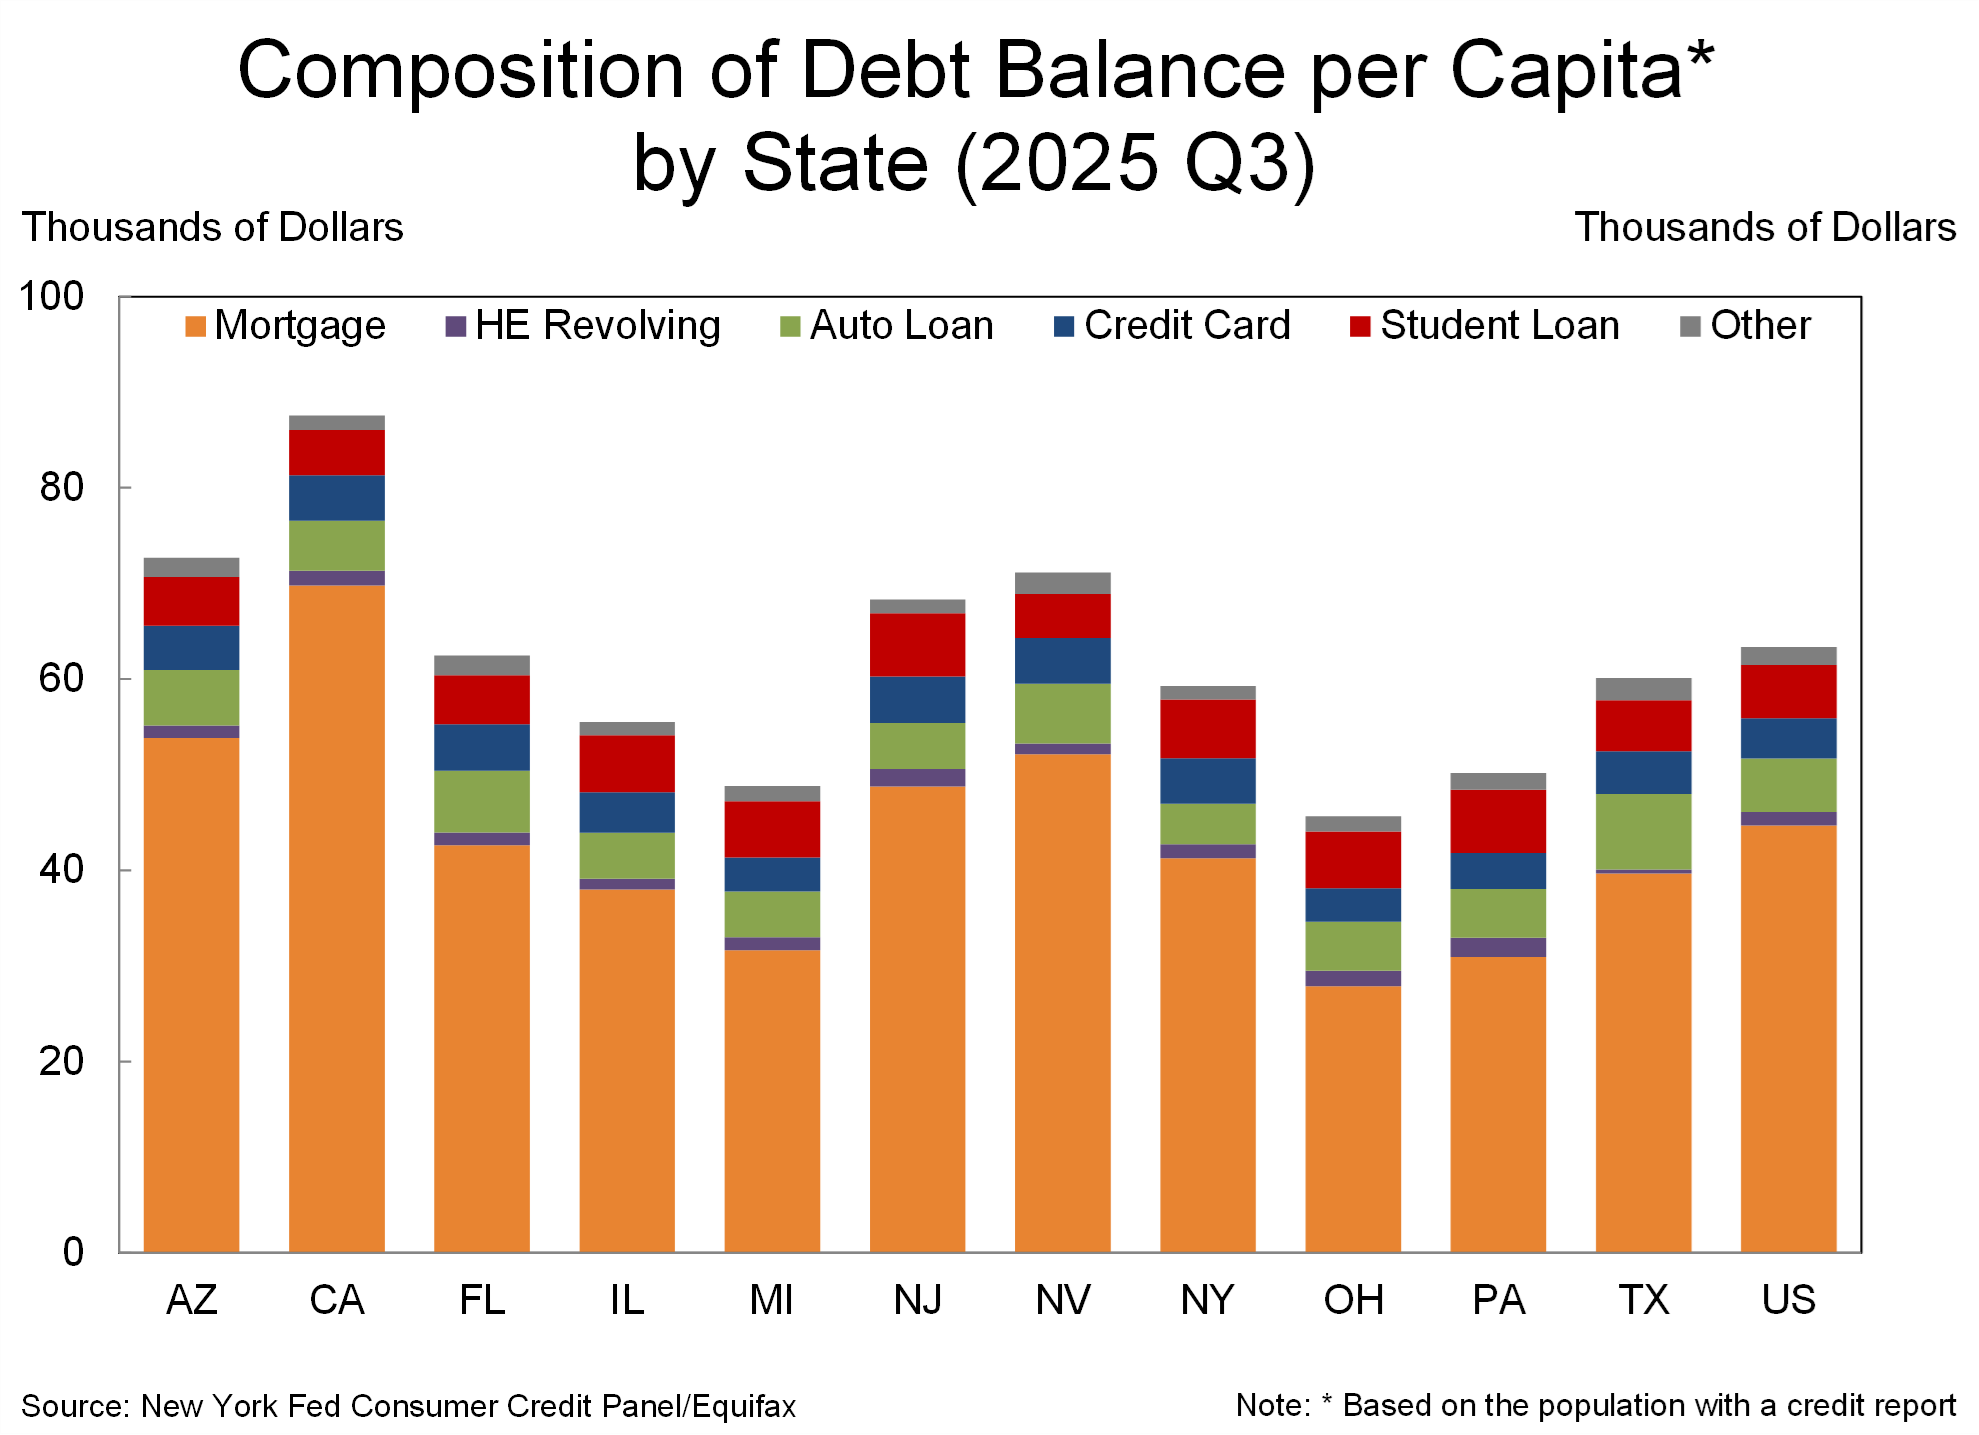
- As true nationally, the composition of the per capita debt balance (broken down by mortgages, Home Equity Line of Credit (HELOC) Revolving, auto loans, credit cards, student loans and other) is heavily skewed towards mortgages, with per capita mortgage debt at 71.3% in 2025Q3, but below the California figure of 79.7%. Auto loans account for 7.0% in New Jersey while student loans account for a heftier 9.7%.
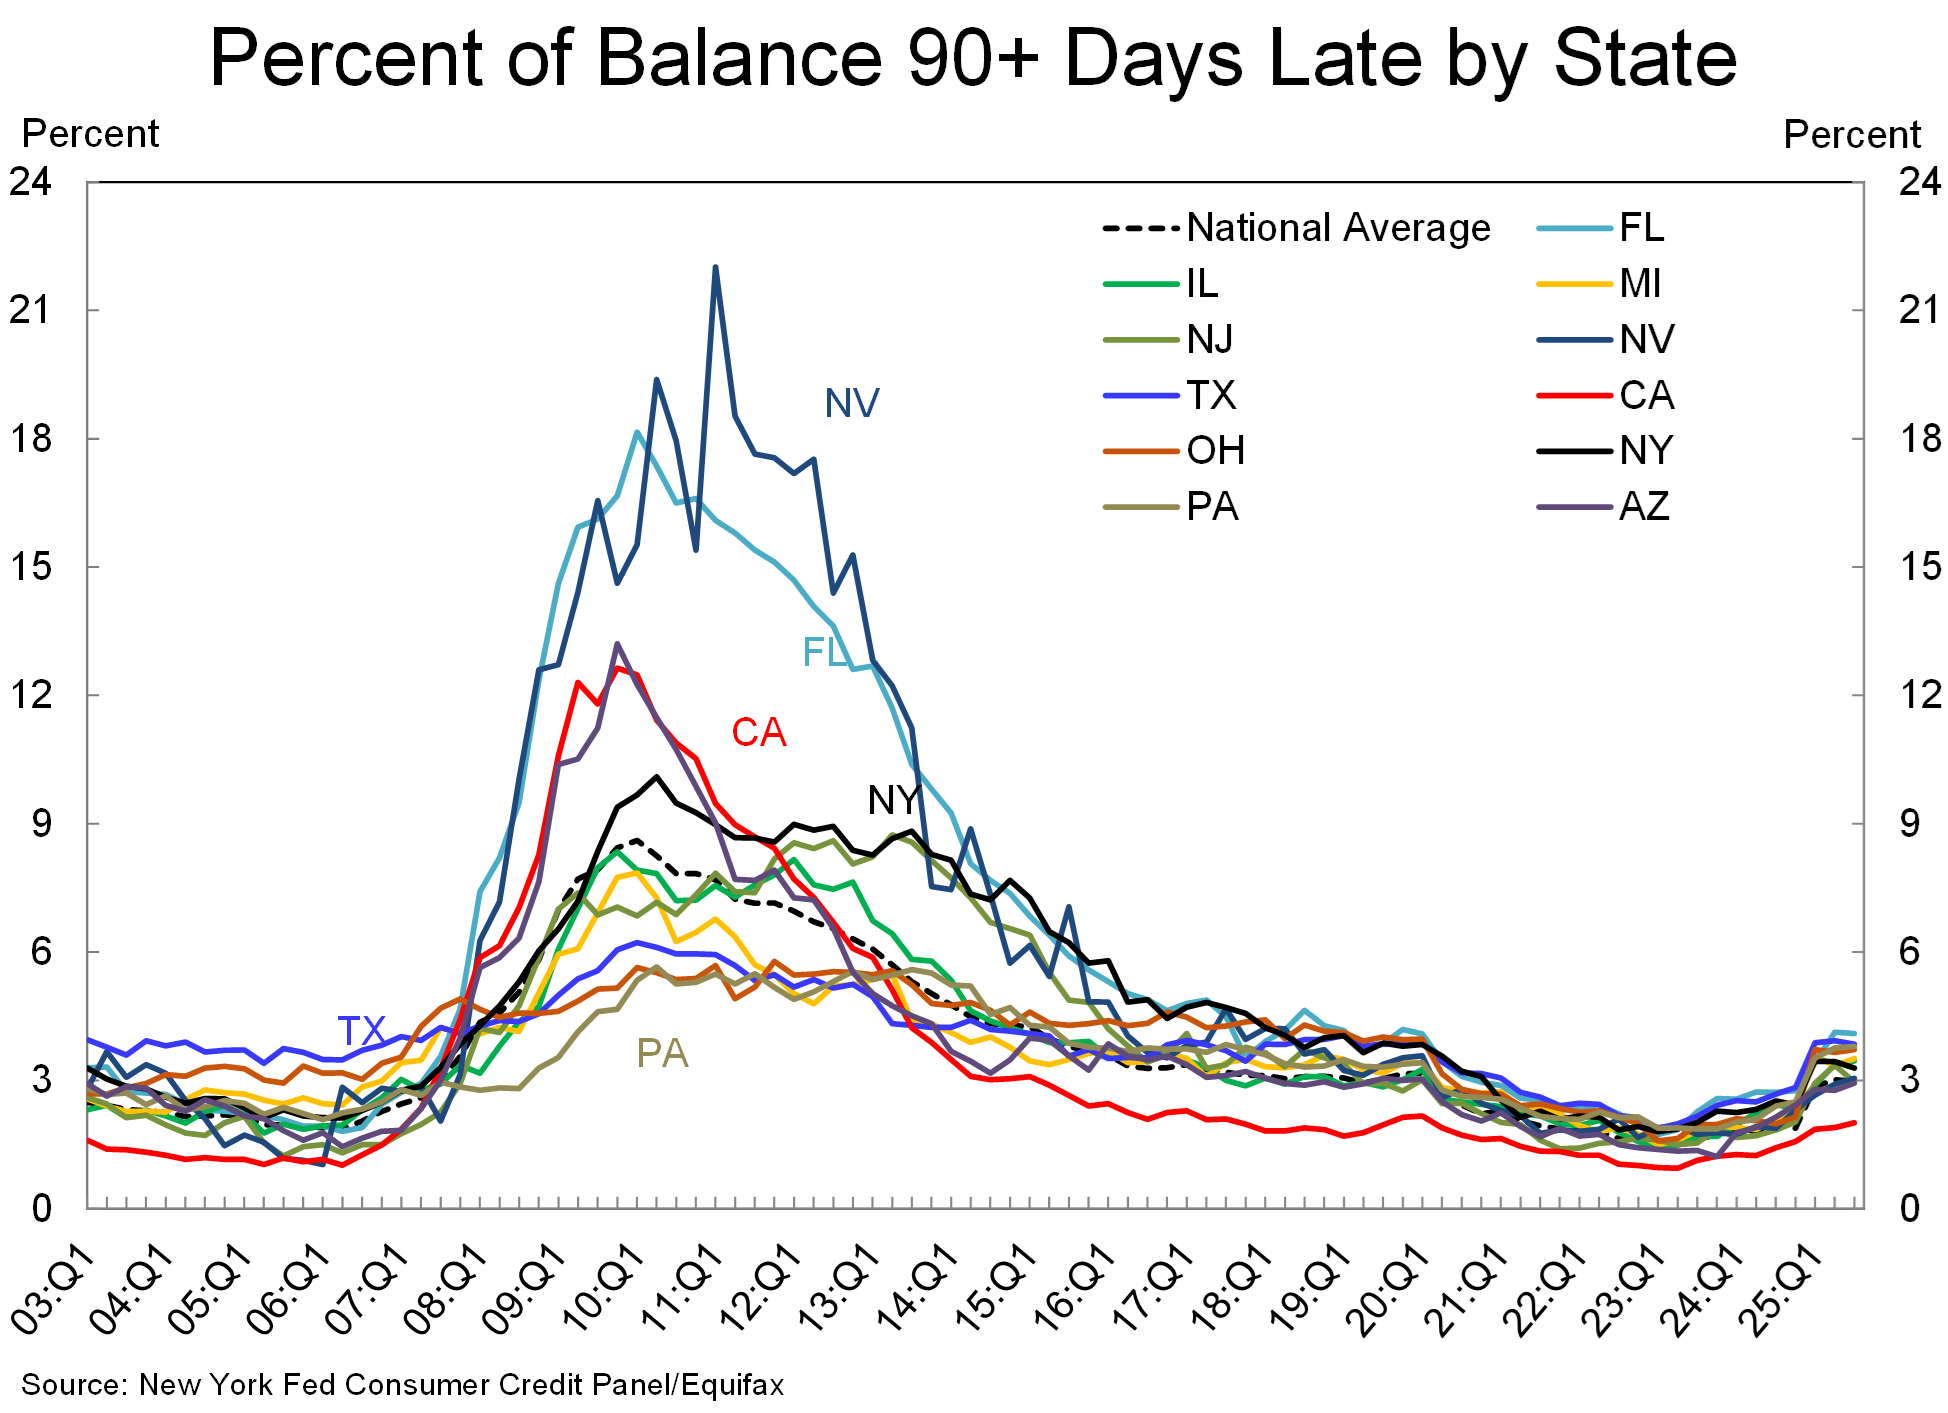
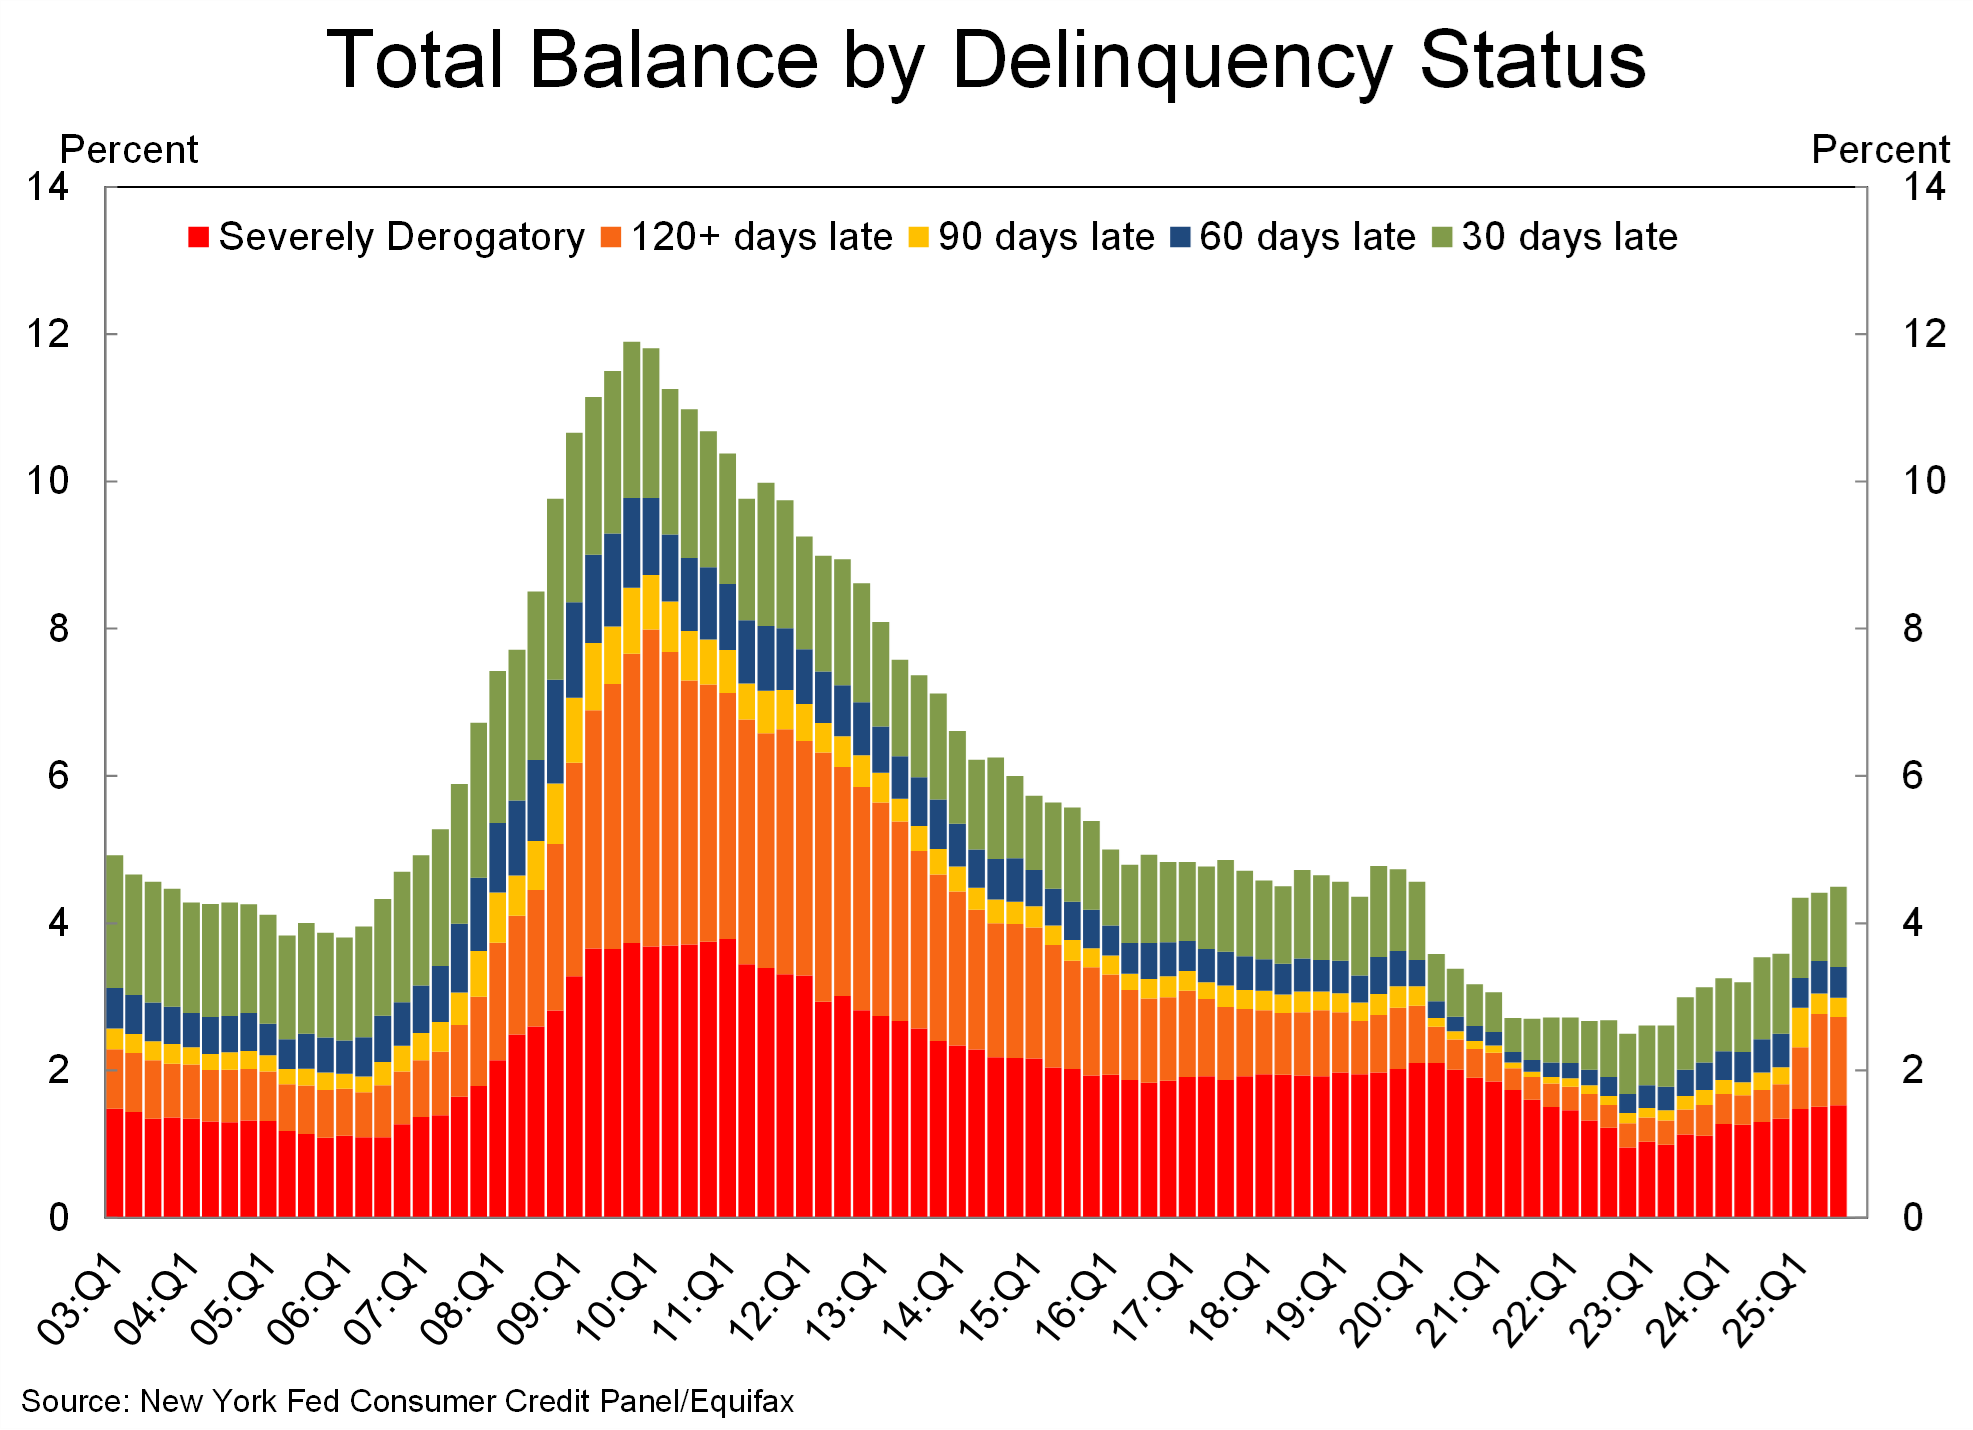
- The delinquency status is showing an uptick for New Jersey. The percent of balances that are 90+ days late stood at 3.0% in 2025Q3 versus 1.8% in 2024Q3. Nationally, the figure was at 3.0% as well for 2025Q3 versus2.0% in 2024Q3. Florida’s delinquency rate was the highest among all states at 4.1% in 2025Q3. These figures indicate that household stresses are emerging, which could get exacerbated if the labor market falters; layoff announcements have increased of late which imparts a negative tone for the future. Nationally, 4.5% of household debt was in some stage of delinquency in 2025Q3, up from 4.4% in 2025Q2, but this also related to the change in the reporting of student loan delinquency rates in 2025Q1. The national figures (second chart below) show that 30-day, 60-day, and 90-day delinquency rates have been flat over the past several quarters but the 120-day delinquency rate and the severely derogatory rate (defined by the New York Fed as a delinquency of any duration combined with a reported repossession, charge-off to bad debt, or foreclosure) have risen sharply during this year and are above pre-pandemic rates. For New Jersey, the 120+ days late and severely derogatory rate appears to be well contained at 1.4% in 2025Q3.
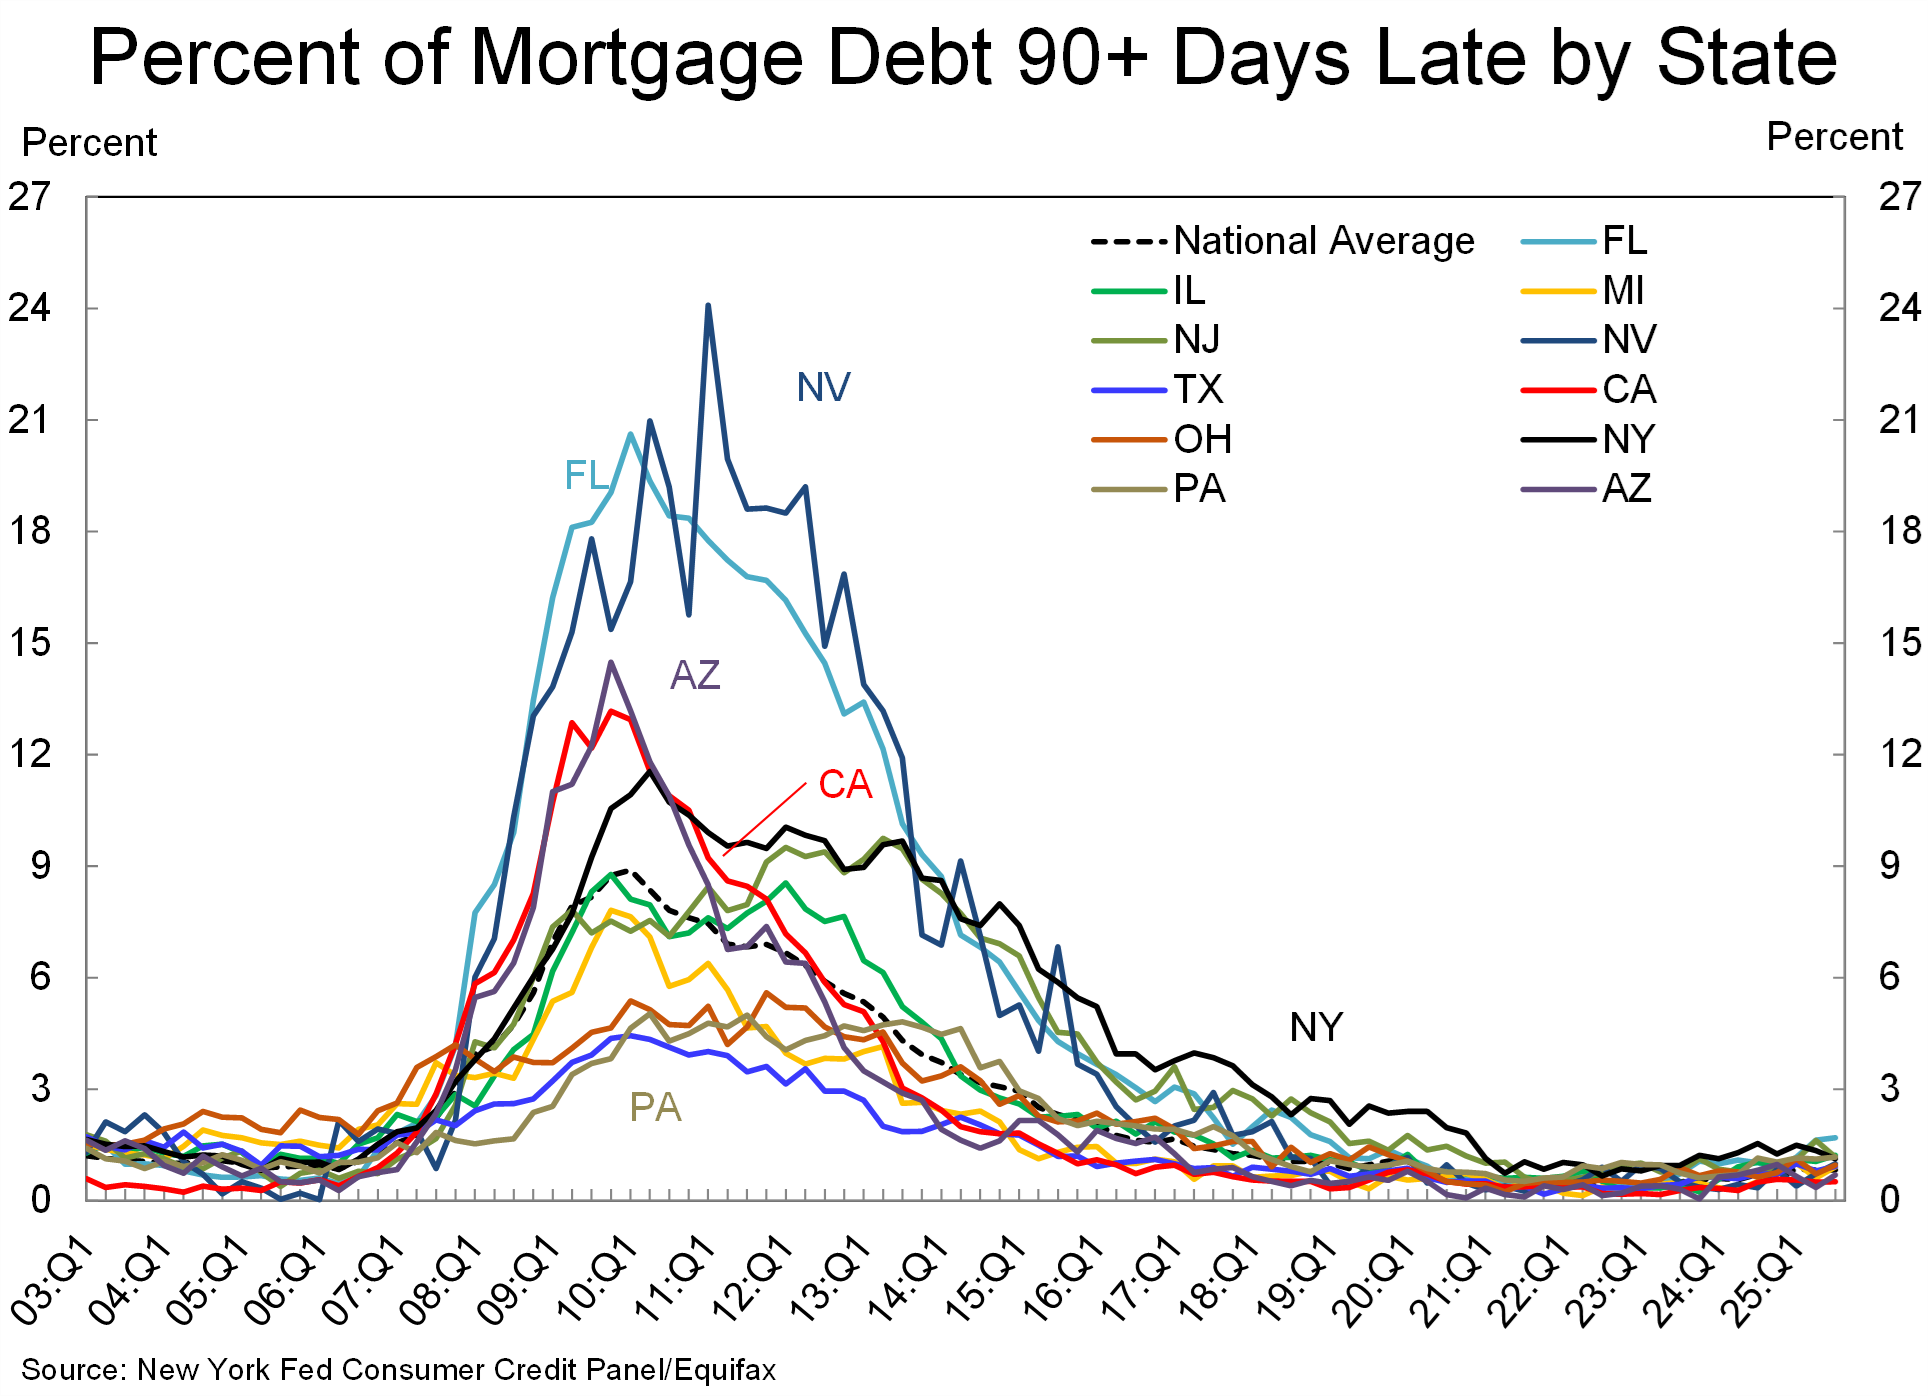
- The good news thus far is that mortgage delinquency rates remain moderate. New Jersey’s percent of mortgage debt 90+ days late moderated to 1.2% in 2025Q3 versus 1.6% in 2025Q2 but still depicts a sharp increase from the 0.8% figure seen in 2024Q3. These figures are also above the national average. The national data shows an alarming jump in the transition into serious delinquency (90+ days late, captured as a four-quarter moving sum) for the 30-39 age group. This group is the most vulnerable group during economic downturn.
![]()
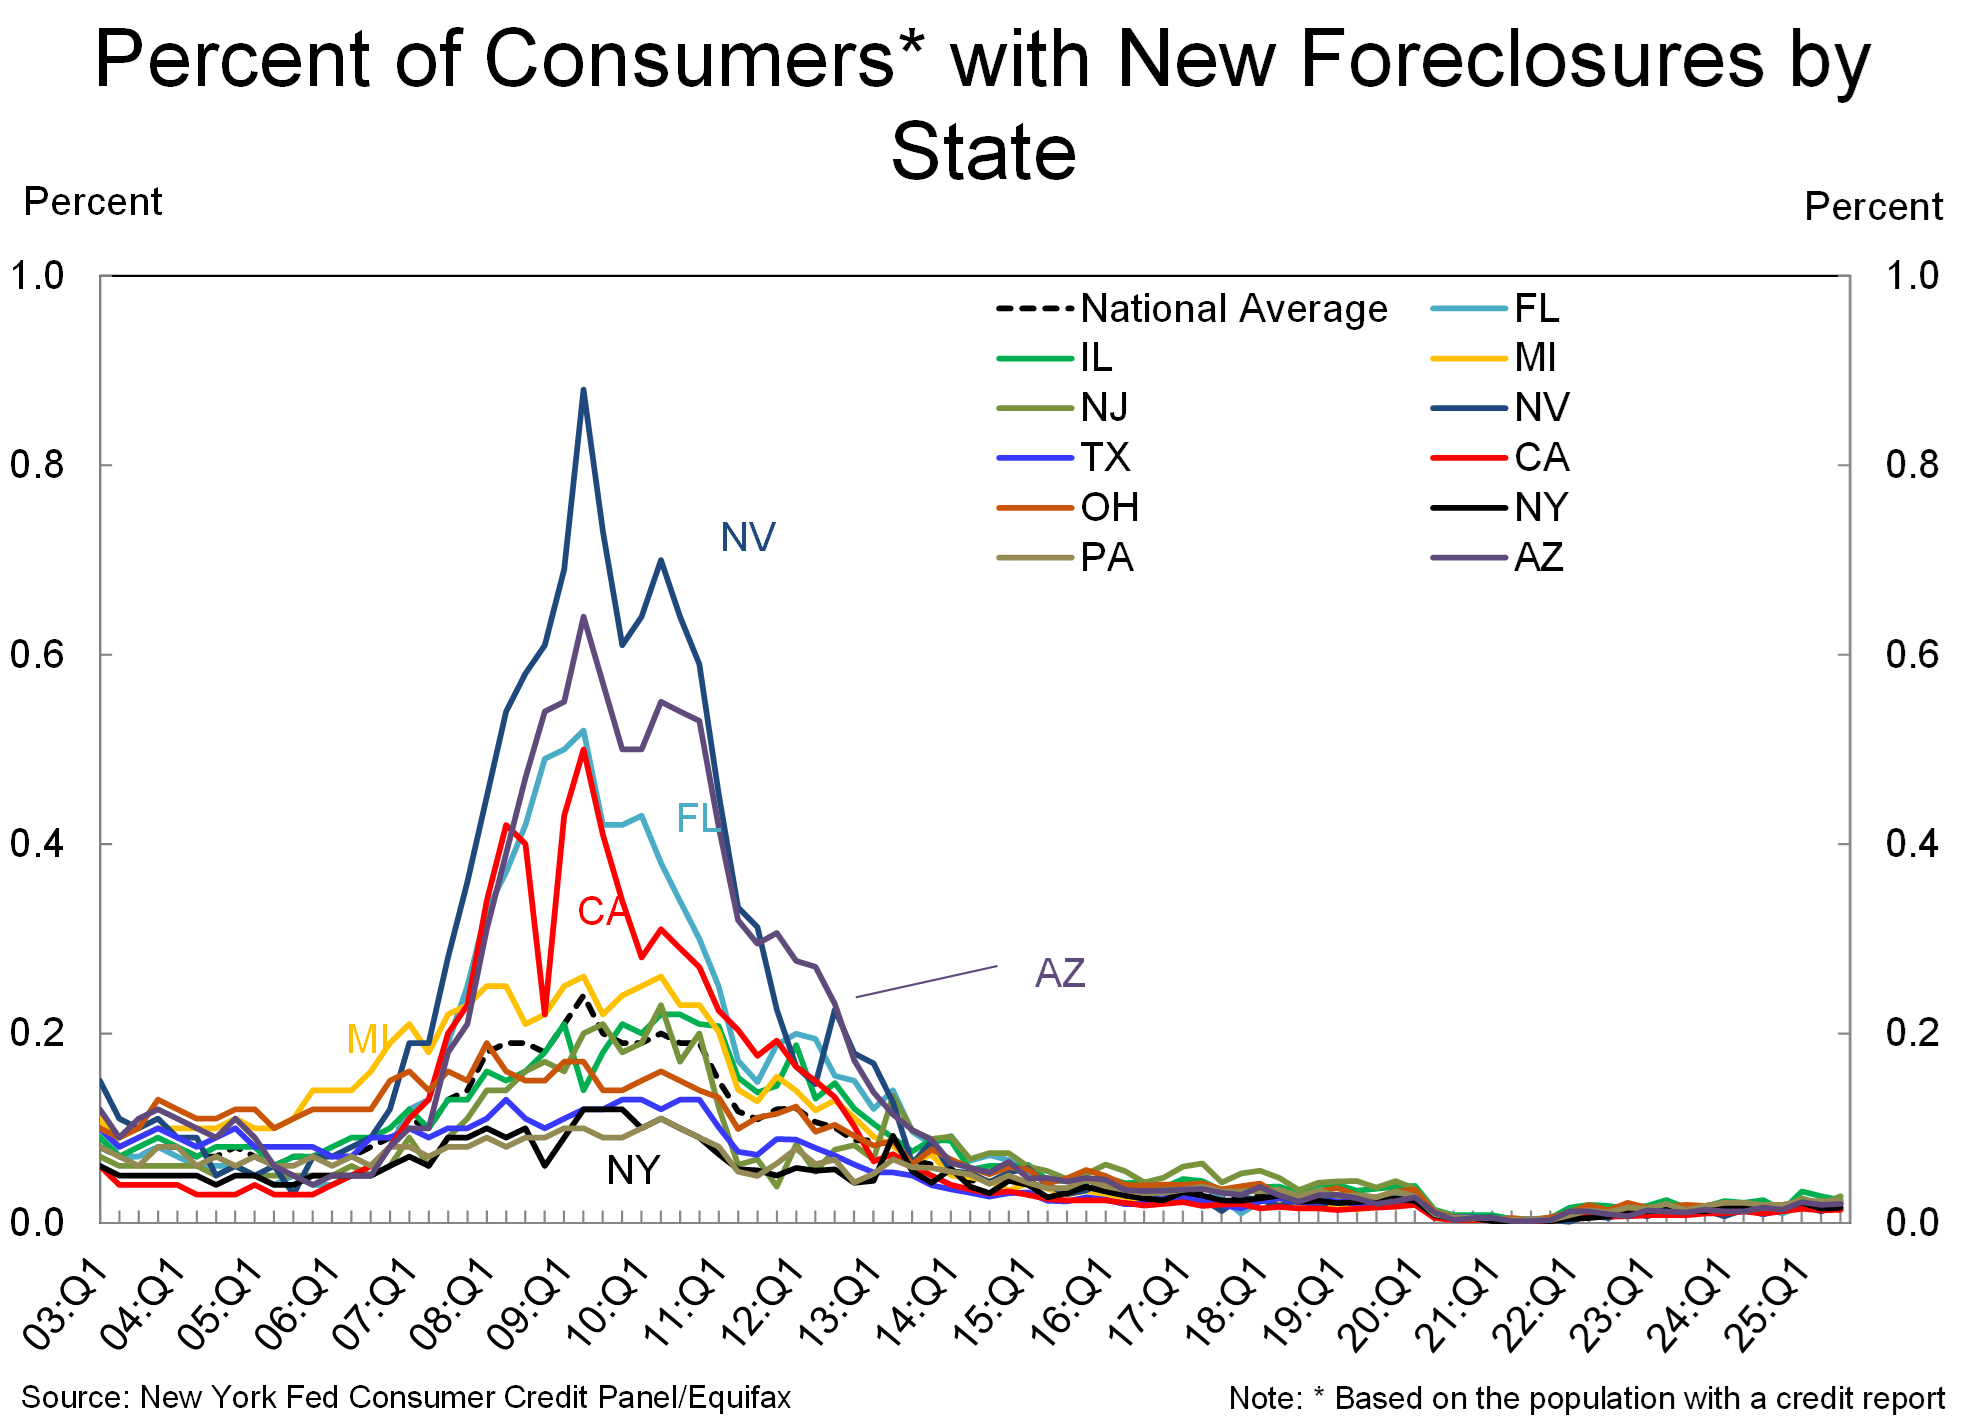
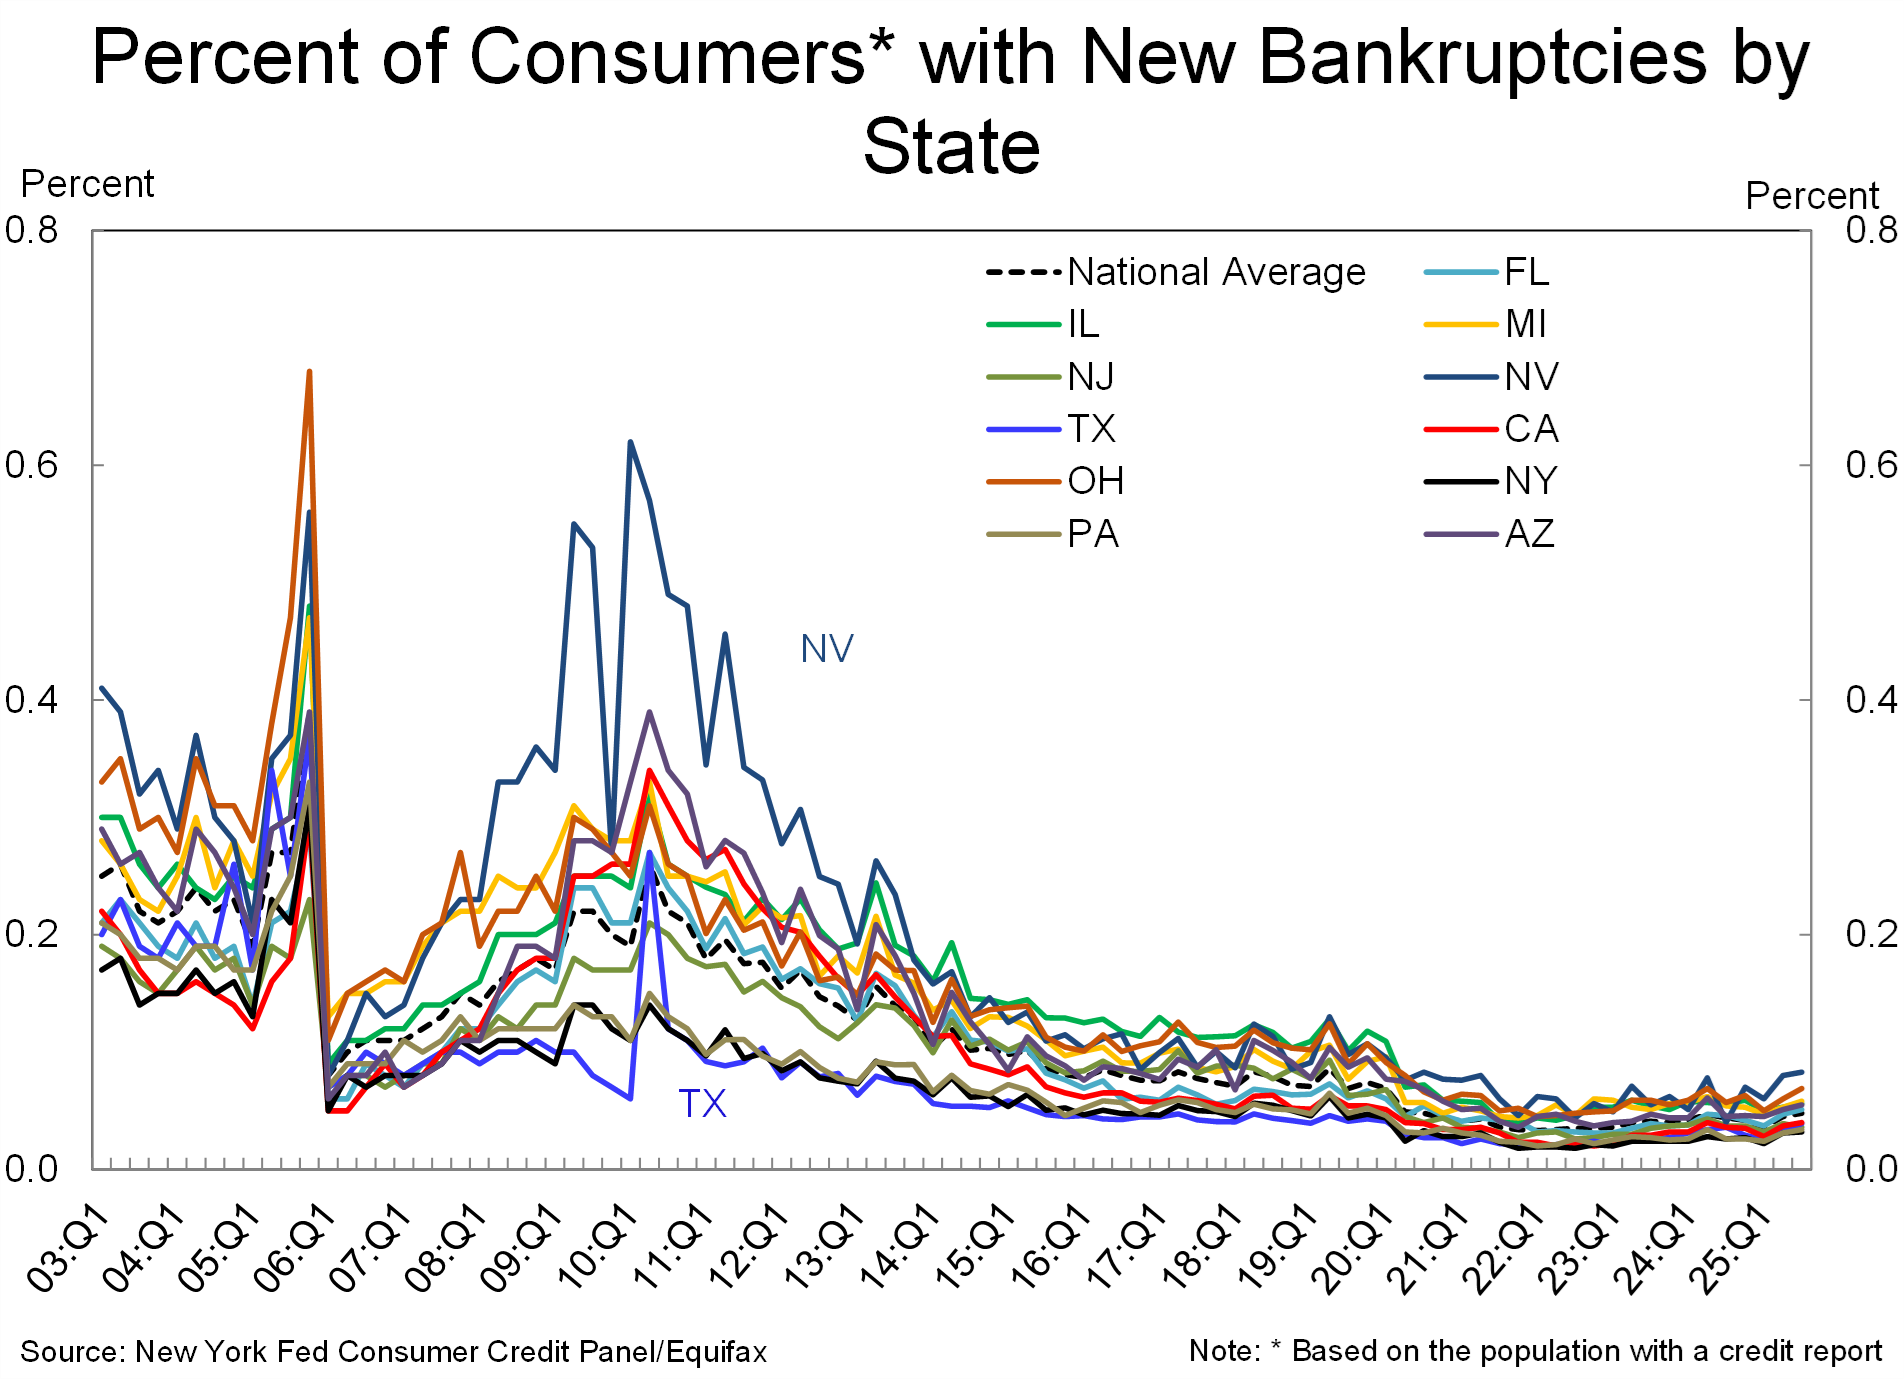
- Consumers with new foreclosures in New Jersey remain moderate at 0.03%, but above the national average of 0.02%. This is a trend worth watching, since the rates did spike during the Great Recession of 2008-2009. The percentage of consumers with new bankruptcies remains moderate as well. It was at 0.04% in 2025Q3, below the national average of 0.05%.
- Perhaps the most alarming statistic in this report is the quarterly transition rates into 30+ days late and 90+ days late, computed as the four quarter moving sum. For the 30+ days late segment, this figure was at 5.4% for New Jersey and 60 to 90+ days at 3.0%. As evident is the graphs below, there is a well-established trend of rising delinquencies, which could escalate if the New Jersey economy weakens.
![]()
![]()