
Higher education plays a pivotal role in both individual career advancement and the long-term economic prosperity of a state. In New Jersey, elevating postsecondary attainment has been a consistent objective[1]. This blog aims to provide an overview of higher education attainment rates in New Jersey, focusing on two primary metrics: attainment rates in 2022 and the progress (change) in attainment rates between 2009 and 2022[2].
In 2022, New Jersey achieved an overall higher education attainment rate of 58.9%[3] among adults ages 25 to 64, securing the 8th position nationally and exceeding the country’s average (54.3%). From 2009 to 2022, the state’s attainment rate trended upward, increasing by 14.4 percentage points (Figure 1).
Excluding short-term credentials (which are not available segmented by race/ethnicity or by county), New Jersey’s degree attainment rates among adults ages 25 to 64 increased across all racial/ethnic subgroups, although performance varied. Specifically, in 2022, degree attainment rates reached 80.3% among Asian or Pacific Islander (API) adults, 60.5% among White adults, and 45.5% among American Indian or Alaska Native (AIAN) adults. However, New Jersey’s performance was not as strong among Hispanic and Black adults, who achieved degree attainment rates of 31.8% and 39.1%, respectively (Figure 2).
Improvements in degree attainment rates between 2009 and 2022 across different ethnic/racial subgroups exhibit similarities, except for the API community. Degree attainment rates among AIAN, Black, Hispanic, and White adults increased over ten percentage points; however, the progress among API adults was lower, at 5.7 percentage points (Figure 3).
In 2022, ten out of New Jersey’s 22 counties achieved degree attainment rates exceeding 50%. The top-performing group comprises three contiguous counties – Morris (67.4%), Somerset (67.3%), and Hunterdon (66.6%) – along with Bergen (62.4%) and Monmouth (60.8%). Five counties attained rates ranging from 50% to 60%: Hudson, Middlesex, Burlington, Mercer, and Sussex. Seven counties experienced rates between 44% and 49% (Gloucester, Warren, Union, Cape May, Essex, Camden, and Ocean). The lower-performing counties include Atlantic, Passaic, Salem, and Cumberland (39.3%, 37.0%, 34.0%, and 24.4%, respectively) (Figure 4).
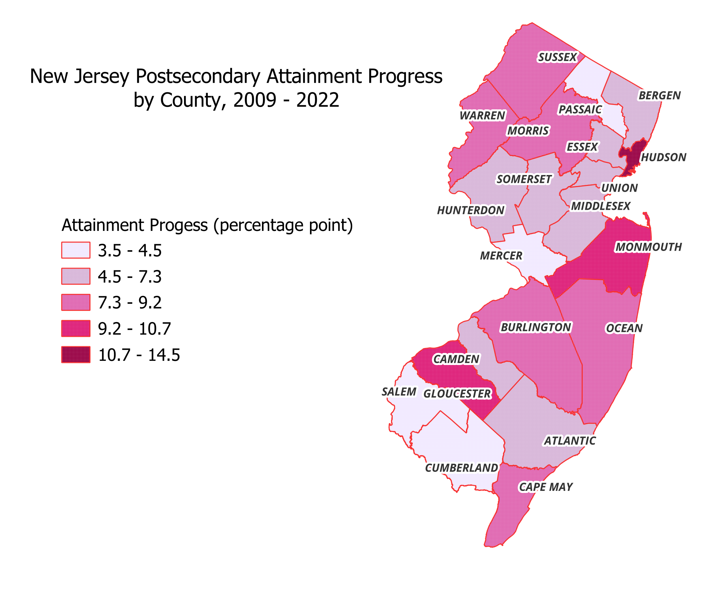
The majority of counties (17 out of 22) witnessed increases of more than five percentage points in postsecondary degree attainment rates between 2009 and 2022. Notably, three counties experienced substantial advancements, with degree attainment rates rising by more than ten percentage points. Hudson led this progress with a significant increase of 14.5 percentage points, followed by Monmouth and Gloucester, both increasing around 10.7 percentage points. In contrast, four counties demonstrated more modest progress in their degree attainment rates (i.e., less than five percentage points), which included Passaic, Cumberland, Salem, and Mercer (4.5, 4.0, 3.9, and 3.5 percentage points, respectively) (Figure 5).
Figure 1. Overall Postsecondary Attainment Rate
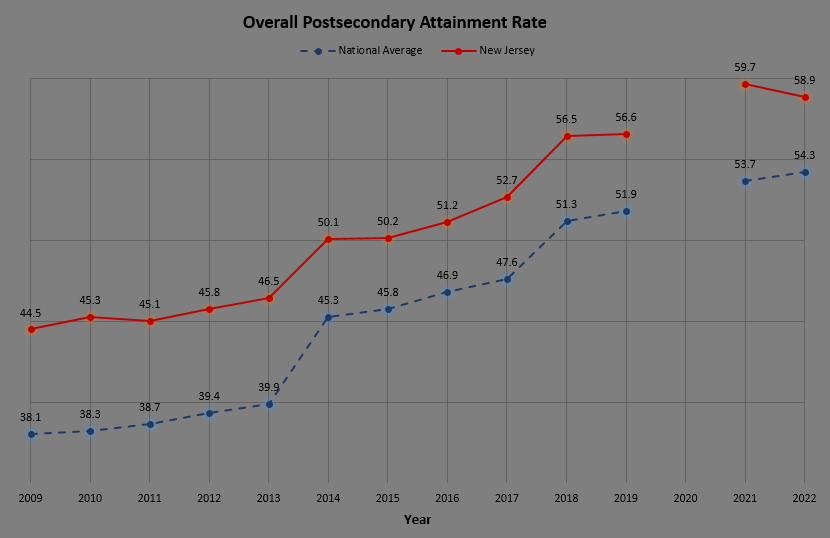
Figure 2. Degree Attainment Rate by Race/Ethnicity
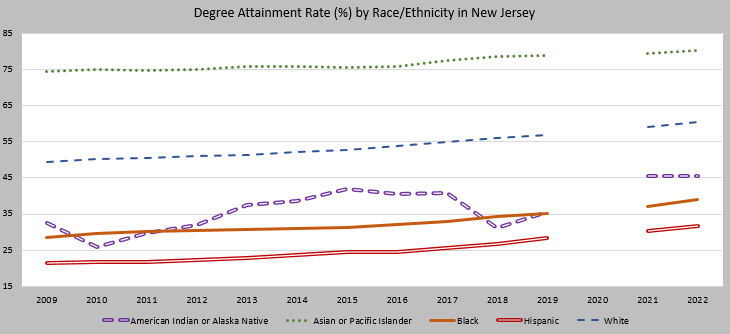
Figure 3. Degree Attainment Progress by Race/Ethnicity
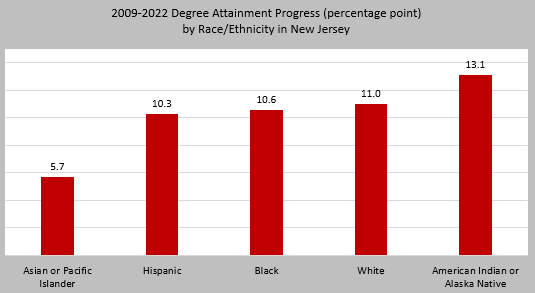
Figure 4. Degree Attainment Rate by County
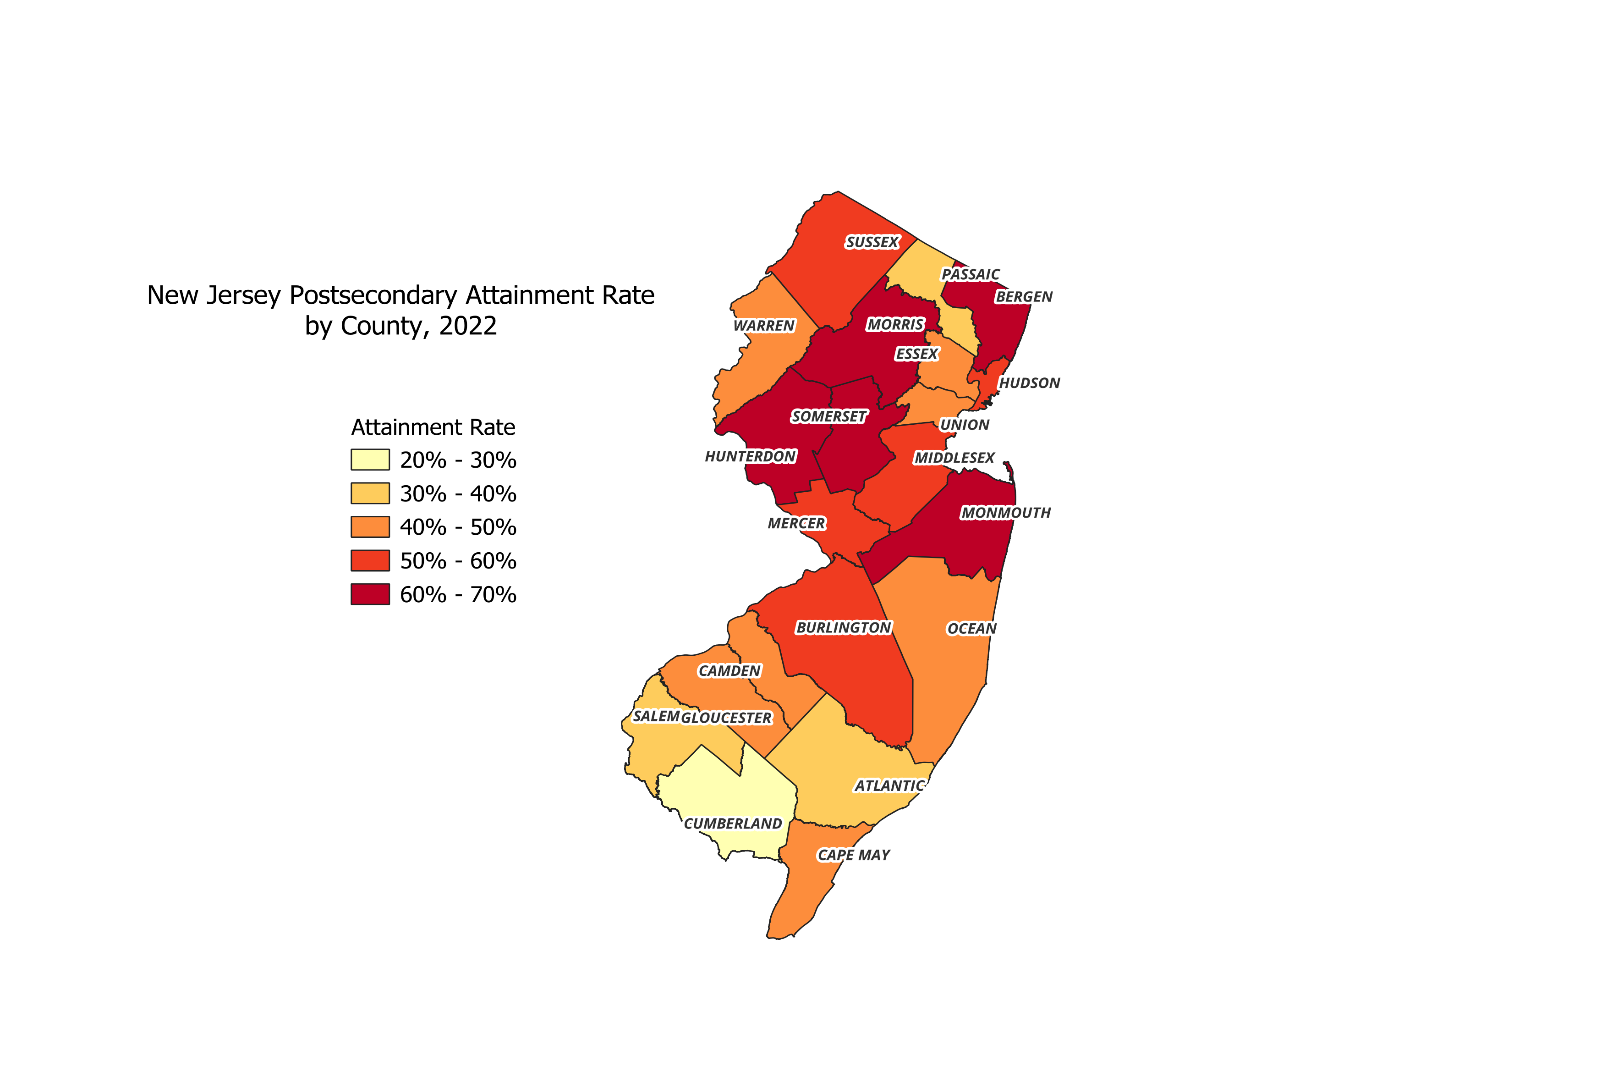
Figure 5. Degree Attainment Progress by County
Angie Nga Le is a postdoctoral associate in New Jersey State Policy Lab. Miranda Alperstein and Suhaib Yehya are master’s students at Edward J. Bloustein School of Planning and Public Policy, Rutgers University – New Brunswick.
References:
[1] Office of the Secretary of Higher Education, State of New Jersey. (2019). Where Opportunity Meets Innovation: A Student-Centered Vision for New Jersey Higher Education. https://www.nj.gov/highereducation/documents/pdf/StateEducationplan.pdf
[2] Based upon the Lumina Foundation’s postsecondary education attainment tracking system for the period from 2009 to 2022. Lumina Foundation. A Stronger Nation – Learning Beyond High School Builds American Talent. https://www.luminafoundation.org/stronger-nation/report/#/progress/state/FL.
Overall attainment rates and progress include short-term credentials. Attainment rates and progress by race/ethnicity and by county do not include short-term credentials. The data are for population ages 25-64. Data for 2020 are not available.
[3] New Jersey’s educational attainment rate of 58.9% includes short-term credentials such as certificates and industry-recognized certifications; without those credentials, the 2022 attainment rate in New Jersey would be 53.4%. The short-term credential data are not yet collected at the county level or disaggregated by race and ethnicity.