
It is vital for New Jersey policymakers to understand what affects municipal tax rates. In this brief, we analyze local government spending and attempt to equalize effective municipal tax rates across New Jersey’s counties. To do this, we identify the variables that moderate the state’s municipal equalized tax rates and examine any county differences that remain, so called “county fixed effects.” We then subtract these fixed effects from the equalized municipal tax rates. To our knowledge this enables the first legitimate comparison of tax rates across county boundaries for New Jersey’s municipalities.
Local Government Expenditures
Local governments spent a total of $48.0 million in 2019. Education services accounted for the highest expenditure share (57%, or $27.4 million). Public safety services had the second highest expenditure share (commanding $4.9 million in local government spending statewide, 10.2%). Several factors influence local spending needs and, in turn, tax rates. Taxes raise the effective “total cost” of a property to the owner. In what follows, we identify each of the central factors affecting local spending, discussing how we measure them and the nature and direction of their influence on property tax rates.
Equalized Property Tax Rates
To analyze the tax rates of New Jersey’s 565 municipalities, we used the equalized tax rate by municipality. “Equalization” ensures each property carries its fair and legal share of the tax burden in every taxing district of a county. The equalized average property tax rate by municipality in 2020 ranged from 0.46 percent to 20.42 percent, and the state average is 2.64 percent.
Factors that Affect Local Spending
Age Dependency Ratios
Dependency ratios are a measure of the non-working age population relative to the population of working age. They express the relationship among three age groups within a population: under 18 years of age, 18 to 64 years of age, and 65 and older. The total age dependency ratio is the sum of the child dependency ratio and the senior or old-age dependency ratio. Generally, a higher dependency ratio suggests a greater need for public services, education services, and/or emergency services.[1] As a result, the working population is likely to receive an increase in taxes to support dependents.
Private School Enrollment
Public schools are the main local expenses for almost all local governments in New Jersey. According to the U.S. Census Bureau, more than 80 percent of school-age New Jersey children attend public schools. Municipalities in which the share of school-aged children in private schools is higher, we should expect the demand for public spending on education services to be lower.[2]
Second Homes
Seasonal housing adds to a municipality’s tax base, while demanding less spending on public goods and services. Statewide, seasonal housing comprises about 4.4% of all housing.
Equalized Average Property Value
The state’s average equalized property value is $423,740. Not only should the negative aspect of higher tax rates be capitalized in the value of the home, but after a certain point, local public spending per capita yields decreasing returns to scale. That is, ceteris paribus high tax rates negatively impact home sales prices because they are a “negative amenity.”
Population Density
Population density is another factor influencing local fiscal expenses. Research has long associated higher population densities with crime, particularly violent crime.[3] Higher crime rates call for a more vigilant local police force, which requires more funding per capita. Moreover, higher population density often translates to a lower need for bussing of school students— although some densely populated municipalities provide school students with vouchers for public transit in lieu of bussing.[4] In the end, the expectations of the effect of a higher population density on local public spending needs is not entirely clear, although some net effect is expected.
Regression Analysis
We performed a regression analysis to examine if and how each of the factors (i.e., variables) listed in the previous section affected the municipal equalized tax rates in New Jersey. We created two interaction variables based on observations made when mapping the variables: we noticed that urban areas often had high shares of private school students, but so did municipalities with high equalized average property values. Similarly, we noticed that many, but not all, communities, with high old-age dependency ratios were in Shore communities and, hence, likely to enjoy large shares of seasonal housing. With an adjusted-R2 of 0.7878, the equation’s fit is quite high for a cross-sectional study.
All variables in the analysis had a statistically significant effect. In general, the directions of effects were as expected. One exception was the coefficient for the old-age dependency ratio, which was negative and, hence, opposite of our tax-enhancing expectations. Combined, the set of variables explains the majority (79.8%—the unadjusted R2) of the variation in the Equalized Municipal Tax Rates.
Municipal Tax Rates for Intercounty Comparisons (only).
Armed with the above statistical results, we next created a set of rates that are comparable across county lines. (For details on this process, consult the linked report.) Figure 1 maps the adjusted and re-centered equalized municipal tax rates for New Jersey in 2020. The numbers themselves are detailed in a separate Appendix—a Microsoft Excel database that we collected for this report. Except for Cumberland and, perhaps, Atlantic counties, the stark color differences across county lines have mostly disappeared. This is particularly true for Camden, Hudson, and Ocean counties. Also, parts of South Jersey, the Highlands, and the set of older communities along the Northeast Corridor stand out with relatively high municipal tax rates. Relatively low tax municipal rates crop up along the shoreline, Hunterdon and Middlesex counties, and close to the border between Morris and Essex counties.
Figure 1: Adjusted Intercounty Equalized Municipal Tax Rates in New Jersey, 2020
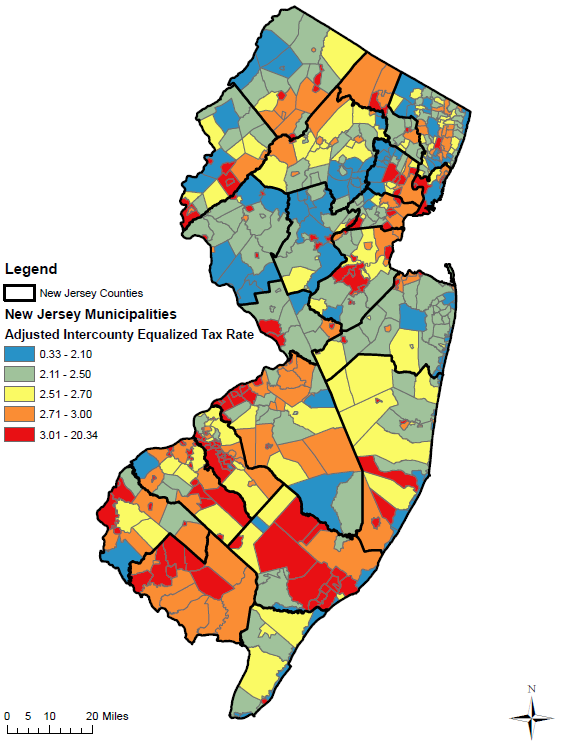
New Jersey Municipal Tax Rates 2020
Source: R/ECON calculations
Conclusions
By subtracting the county fixed effects from the official equalized tax rates (and then re-centering them), we created a new measure that better facilitates cross-county comparison of the tax rates. Parts of South Jersey, the Highlands, and the set of older communities along the Northeast Corridor still stand out as having relatively high municipal tax rates. Relatively low tax municipal rates arise along the shoreline, Hunterdon and Middlesex counties, and close to the border between Morris and Essex counties. The database used in the analysis shows the details.
[fusion_button link=”https://rutgers.app.box.com/file/1008877543820?s=rec136z42uxc5gwvtggpfdtrxylawex1″ text_transform=”” title=”” target=”_blank” link_attributes=”” alignment_medium=”” alignment_small=”” alignment=”center” modal=”” hide_on_mobile=”small-visibility,medium-visibility,large-visibility” sticky_display=”normal,sticky” class=”” id=”” color=”default” button_gradient_top_color=”” button_gradient_bottom_color=”” button_gradient_top_color_hover=”” button_gradient_bottom_color_hover=”” accent_color=”” accent_hover_color=”” type=”” bevel_color=”” border_width=”” border_radius=”” border_color=”” border_hover_color=”” size=”” stretch=”default” margin_top=”” margin_right=”” margin_bottom=”” margin_left=”” icon=”” icon_position=”left” icon_divider=”no” animation_type=”” animation_direction=”left” animation_speed=”0.3″ animation_offset=””]READ REPORT[/fusion_button]
[fusion_button link=”https://rutgers.app.box.com/file/1010034465832?s=bx7usltumavxmsbyiwuajxuokj69vpdk” text_transform=”” title=”” target=”_blank” link_attributes=”” alignment_medium=”” alignment_small=”” alignment=”center” modal=”” hide_on_mobile=”small-visibility,medium-visibility,large-visibility” sticky_display=”normal,sticky” class=”” id=”” color=”default” button_gradient_top_color=”” button_gradient_bottom_color=”” button_gradient_top_color_hover=”” button_gradient_bottom_color_hover=”” accent_color=”” accent_hover_color=”” type=”” bevel_color=”” border_width=”” border_radius=”” border_color=”” border_hover_color=”” size=”” stretch=”default” margin_top=”” margin_right=”” margin_bottom=”” margin_left=”” icon=”” icon_position=”left” icon_divider=”no” animation_type=”” animation_direction=”left” animation_speed=”0.3″ animation_offset=””]LINK TO DATABASE[/fusion_button]
References:
[1] Roldan, N. V., Coyle, C. E., Ward, M., & Mutchler, J. (2019). Impact of aging populations on municipal emergency medical services. Innovation in Aging, 3(Suppl 1), S956.
[2] Goldhaber, D. (1999). An endogenous model of public school expenditures and private school enrollment. Journal of Urban Economics, 46, 106–128.
[3] See, e.g., Christens, B. & P.W. Speer. (2005). Predicting violent crime using urban and suburban densities. Behavior and Social Issues, 14: 113–128.
Moore, M.D. & C. M. Bergner. (2016). The relationship between firearm ownership and violent crime. Justice Policy Journal: 13(1): 1–20.
Wang, W. & Y. Wu. (2018). Why are we lagging behind? An empirical analysis of municipal capital spending in the United States. Public Budgeting & Finance 38(3): 76-91.
[4] Sullivan, V. L. (2017). Impact of Free Transit Passes on Youth Travel Behaviour. Master’s thesis, University of Waterloo. Available online in August 2022 at https://uwspace.uwaterloo.ca/bitstream/handle/10012/12199/Sullivan_Veronica.pdf?sequence=3.
Wexler, N., G. Ryan, K. Das, & Y. Fan. (2021). Free Transit Passes and School Attendance among High School Students. Transportation Research Record 2675 (8), 135-147.