
In 2022, the U.S. Department of Transportation announced its Vision for Roadway Safety in which the agency aims to eliminate deaths on all highways, roads, and streets. The New Jersey Department of Transportation (NJDOT) has adopted the Zero Deaths National Strategy with the vision of achieving zero fatalities on all public roads by the year 2050. The reframing of transportation safety outcomes from a perspective that assumes traffic deaths are inevitable (or acceptable) to a vision and goal of eliminating all fatalities is the right direction and important to prioritizing safety for the most vulnerable road users, including people who walk, bike, or travel by some other wheeled and mobility apparatus. The question is, how will we achieve the goal of zero deaths?
In New Jersey, fatal pedestrian and bicycle crashes account for one third of all traffic fatalities in the state (30.6% in 2020), substantially higher than the national average of 16.8% (in 2020). In May 2023, we published an article in the Journal of Safety Research which analyzed the factors influencing the fatality of pedestrian and cyclist crashes. We combined NJDOT Safety Voyager crash data with NJ Department of Environmental Protection (NJDEP) Overburdened Communities data to assess equity and safety issues concerning pedestrian and bicycle involved crashes in the state between 2016 and 2020.
Per capita, both fatal and non-fatal pedestrian and bicycle involved crashes occurred disproportionally more often in low-income neighborhoods. Street lighting conditions, posted speed limit, and vehicle type were among the most significant factors influencing the fatality of pedestrian and bicycle involved crashes. Specifically, crashes in the dark without streetlights were 6-7.5 times as likely to be fatal than in the daytime. A posted speed limit greater than 40mph was associated with 3-5 times greater likelihood of fatality for cyclists and pedestrians. In addition, data available for the DVRPC region (Camden, Burlington, Mercer, and Gloucester Counties) offered an opportunity to analyze the presence of sidewalks and crosswalks in relation to crash risk. We found that, after controlling for other factors, the presence of a crosswalk or sidewalk was associated with decreased risk of a fatal crash for pedestrians (1.6 times).
Bicycle-involved crashes had slightly different factors influencing fatality. Vehicle type was the largest factor: a bicycle crash involving a truck or bus was up to 13 times as likely to be deadly, compared to being struck by a car. Lighting remained an important factor as well. Moreover, cyclist crashes in low-income neighborhoods were more likely to be fatal (1.6 times) – a finding that we attribute to fewer roads with lower posted speeds and less dedicated bicycle infrastructure.
Complete data is of utmost importance in order to achieve zero deaths. Crash data is used to identify corridors and hotspots for funding projects that improve safety (Figure 1). We analyzed data availability as part of our study. Geocoded information that enables crash locations to be mapped was unavailable for 10% of New Jersey pedestrian- and bicycle-involved crashes, and crashes were less likely to be geocoded in overburdened communities. The number of traffic lanes, vehicle make and model, and other road-related variables were missing in over 20% of crashes, making it impossible to test in our models. Crosswalk and sidewalk data are currently only available in the four county DVRPC region. Bike lane data is unavailable statewide. Actual motor vehicle speeds are often unknown, but vehicle speeds can be the difference between life and death.
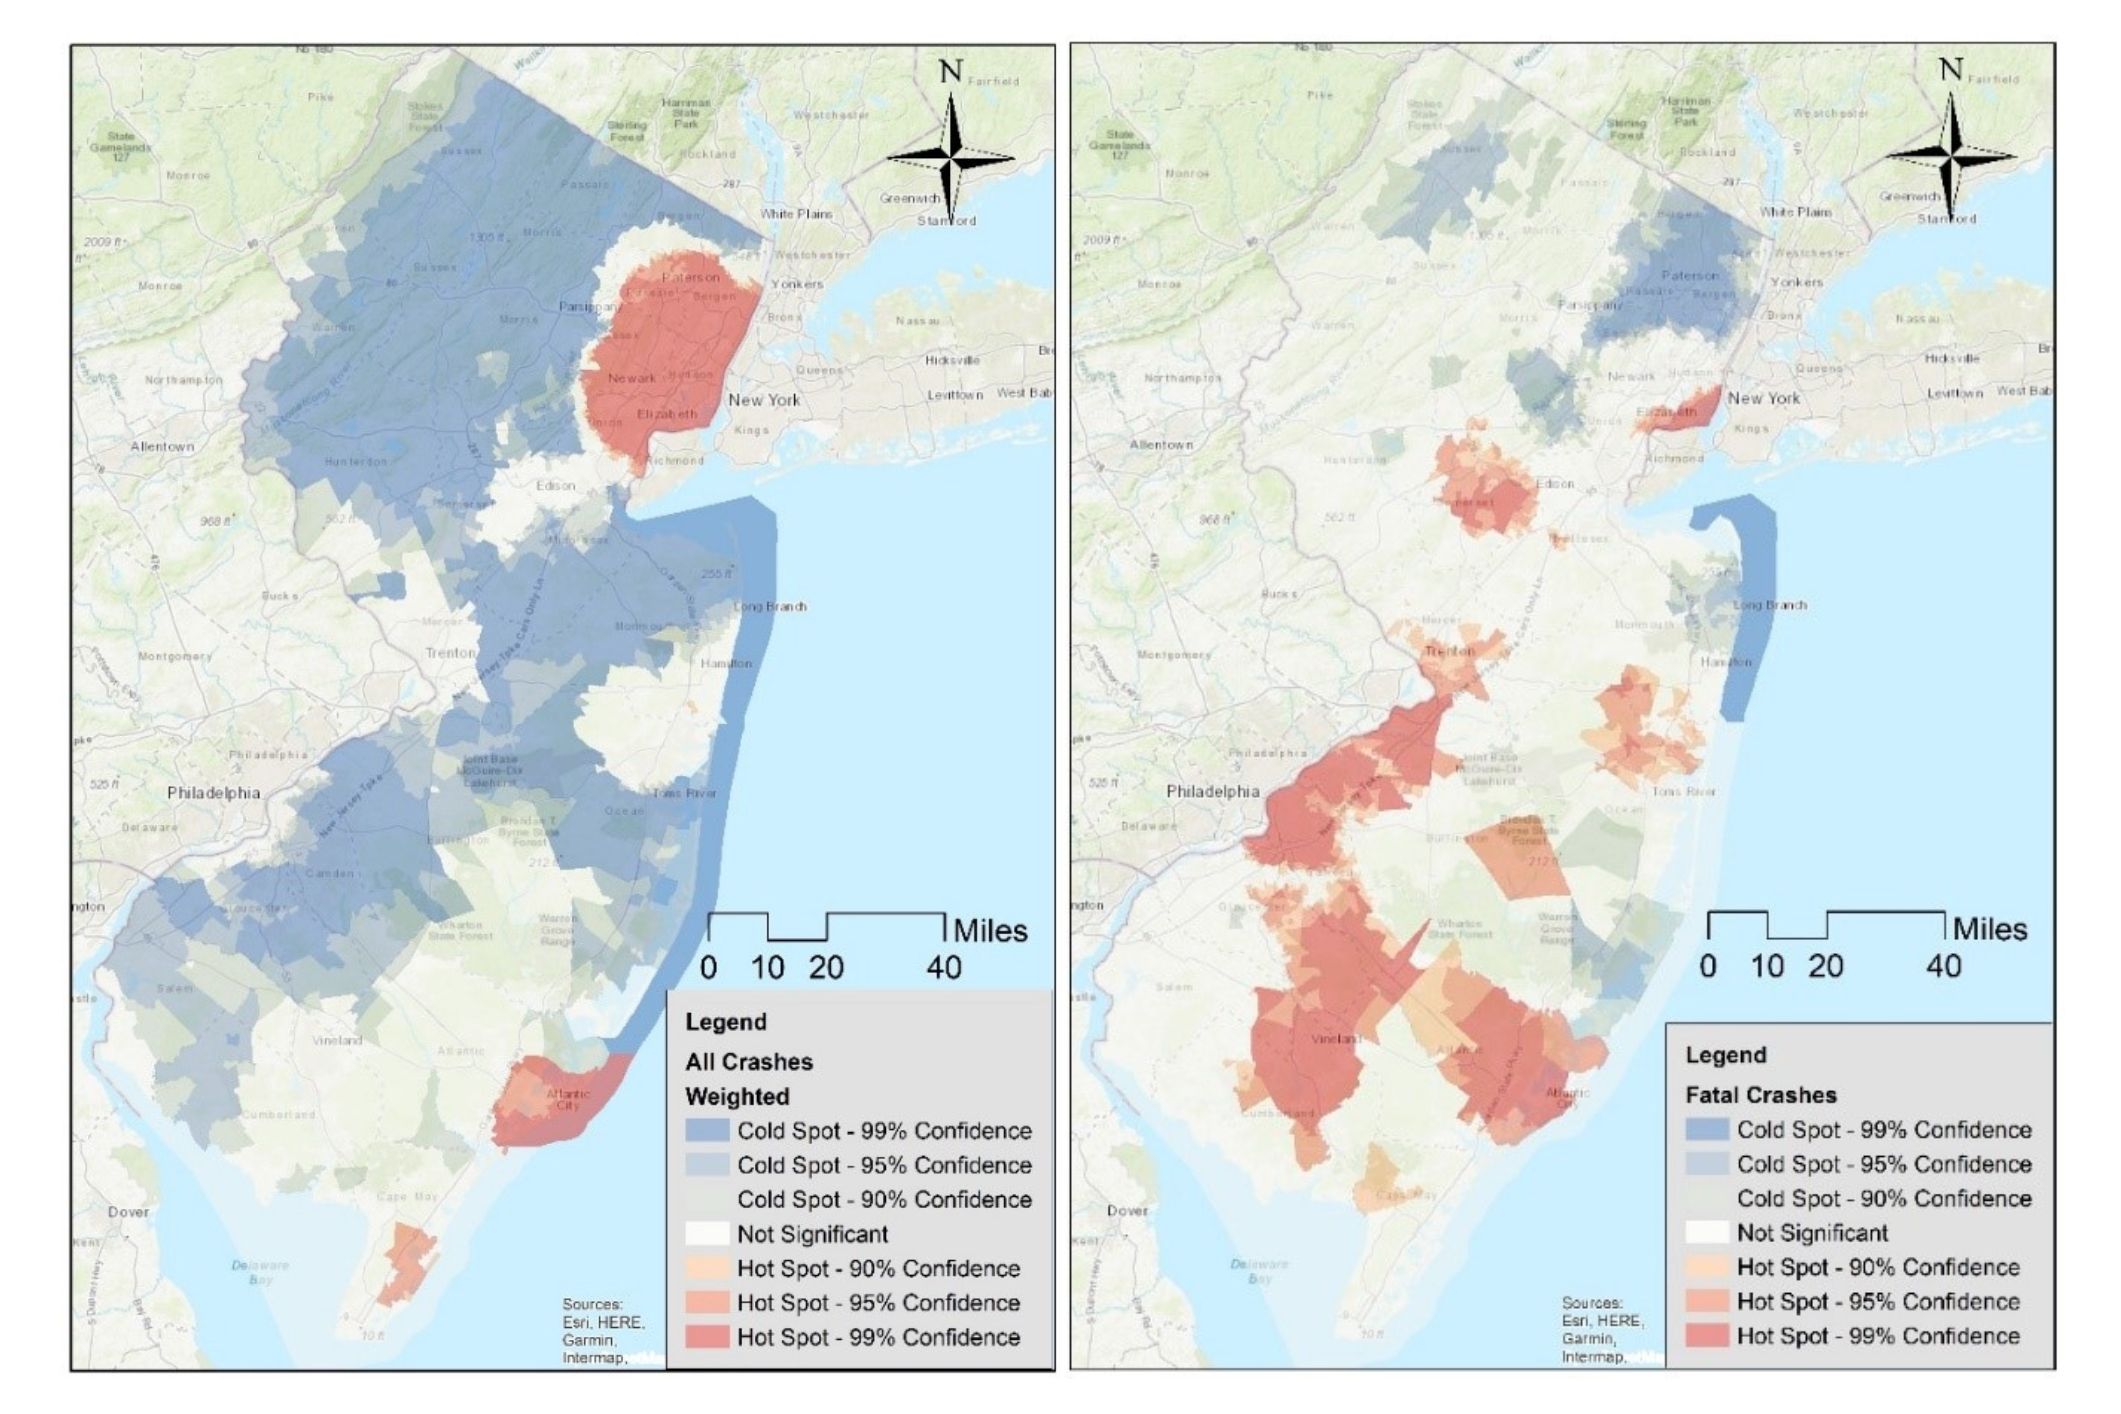 Figure 1: All (left) and fatal (right) pedestrian- and cyclist-involved crash hotspots in New Jersey.
We are at a crossroads where fatal crashes continue to increase and funding opportunities for safety improvements are abundant due to the passing of the federal Infrastructure Investment and Jobs Act (IIJA) in 2021 that has led to a 60% increase in state-administered federal-aid infrastructure grant programs via the Transportation Alternatives Program (TAP). TAP has historically been spent for on- and off-road bicycle facilities, streetscape improvements for pedestrians, and Safe Routes to School infrastructure. In addition, several newly created federal funding sources, including the Safe Streets and Roads for All Program (SS4A), specifically aim to eliminate roadway deaths and serious injuries.
It is imperative that the state of New Jersey spend this money wisely on projects that lead to real reductions in traffic deaths. However, if we continue to build the same infrastructure that does not address speeds, lighting, and other elements that make it challenging for people to walk and bike safely, we will not meet the zero death goals for New Jersey. We need to move past business as usual with designing and maintaining streets. Infrastructure projects designed to prioritize pedestrian safety have not always reduced speeding, even in school zones. To fully embrace vision zero goals, infrastructure that serves vulnerable road users needs to be prioritized over motor vehicle speeds. That will require adequate and complete data, increased training to engineering and transportation professionals, and proper evaluation methods (e.g., before and after speed studies).
References:
U.S. Department of Transportation. (2022) National Roadway Safety Strategy. https://www.transportation.gov/sites/dot.gov/files/2022-02/USDOT-National-Roadway-Safety-Strategy.pdf
New Jersey Department of Transportation. (2022) Highway Safety Overview. https://www.state.nj.us/transportation/about/safety/
Younes, H., R.B. Noland, L.A. Von Hagen, S. Meehan. (2023) Pedestrian- and bicyclist-involved crashes: Associations with spatial factors, pedestrian infrastructure, and equity impacts. Journal of Safety Research. https://doi.org/10.1016/j.jsr.2023.05.005
Delaware Valley Regional Planning Commission. Pedestrian Portal. https://www2.dvrpc.org/asp/dvrpcwalk/explore
New Jersey Bicycle & Pedestrian Resource Center. The Money Trail: A Comprehensive List of Funding Resources for Active Transportation in New Jersey. https://njbikeped.org/the-money-trail/