
Introduction to the Arab Community
Ethnic identity can be a complex topic, and one that is challenging to adequately capture in national surveys. The Middle East and North Africa (MENA) countries are ethnically diverse and comprised of various Arab and non-Arab groups; the latter includes Persians, Turks, Kurds, Assyrians, Armenians, and more. Interestingly, the U.S. Census Bureau classifies almost all “original peoples of Europe, the Middle East, or North Africa” as White.
New Jersey is home to three of the top ten county-based Arab ethnic enclaves in the United States: Hudson County, Passaic County, and Bergen County. Paterson City has a particularly sizable MENA population. Prominent organizations, like the Arab American Institute, argue that Census data underestimate the Arab American or Middle Eastern Population in general. Does this raise the specter that the Census Bureau should apply MENA as a category for identification separate from White? For Arab Americans, this is important since the federal government uses Census data to allocate funds for many public services.
The 2015 National Content Test
A 2015 Census study examining whether a “Middle Eastern/North Africa” category is worthy of a separate distinction from White concluded that “it is optimal to use a dedicated Middle Eastern or North African response category.” Such a national content test shows that Arabic-speaking people in the U.S. more strongly identify with a distinct MENA category than with a White label. Additionally, a distinct Middle East and North Africa category, as opposed to an Arab category, would be more inclusive of non-Arab minorities in Arabic-speaking countries. Furthermore, it would not exclude countries like Sudan and South Sudan that are Arabic-speaking and identify as Black (as shown on the 2015 National Content Test).
This analysis focuses on New Jersey’s Arab MENA population, based upon American Community Survey (ACS). To support the idea of a separate category, the White portion of the Arab population must show strong distinctions from the broader White population.
The 2020 1-Year ACS microdata enable identification by country of birth, language usage, country of origin, and ancestry. This analysis explicitly includes people who were born in the countries of Algeria, Egypt, Iraq, Jordan, Kuwait, Lebanon, Libya, Morocco, Saudi Arabia, Syria, Tunisia, United Arab Emirates, and Yemen[i] and excludes New Jerseyans from countries like Armenia, Turkey, and Iran. Also, the Palestinian community has no official country of origin to identify.[ii] This analysis includes all people who self-identify as White and who also report their ancestry as Arab, Arabic, and Other Arab, or who report their main language as Arabic.
American Community Survey (ACS) Findings
In the 2020 ACS, New Jersey was home to 97,154 people who identify as being Arab (1.1%).[iii] Notably, the ACS also has no explicit option for identifying MENA as an ethnicity or race. Interestingly, 12.7 percent of the state’s Arab population does not identify as White.
Income
This analysis relies on household income to distinguish Arab New Jerseyans from White New Jerseyans. The median annual income for White households in New Jersey is around $121,700, compared with $92,200 for Arab households. The bar graph in Figure 1 shows the main differences in household income distribution between White New Jerseyans and Arab New Jerseyans. Importantly, Arab New Jerseyans are twice as likely as White New Jerseyans to earn less than $35,000 a year (11.1% versus 24.9%). They are also half as likely to earn more than $125,000 a year (22.0% versus 45.0%). It is, thus, clear that the White Arab New Jerseyans are far more apt than other White New Jerseyans to earn less income, which lends value to the Census Bureau availing a separate label for identification as a person of Middle Eastern and North African ancestry since it could enable better targeting of public services to this group.
Figure 1: Household Income Distribution for New Jersey (White v. White Arab)
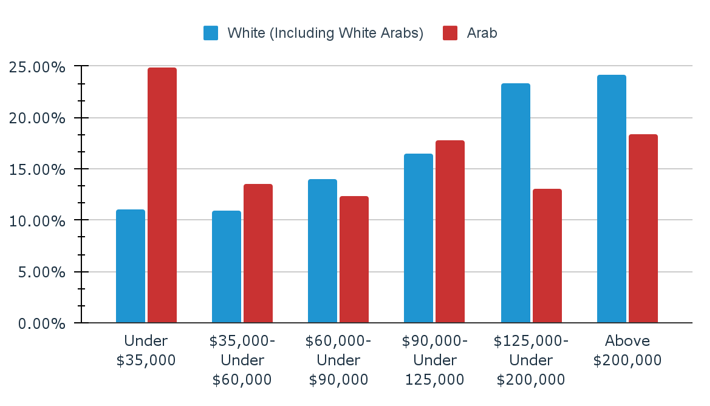
Source: ACS 2020 1-year Microdata with R/ECON Calculations
White Arab households also tend to be larger. In New Jersey, White Arab households are more likely than White households to include four or more people (60% versus 42%). See Figure 2.
Since larger households tend to require more income to sustain a standard of living and quality of life, these findings suggest that White Arab households in New Jersey may be socio-economically more vulnerable than White households.
Figure 2: Number of People in White and White Arab Households in New Jersey, 2020
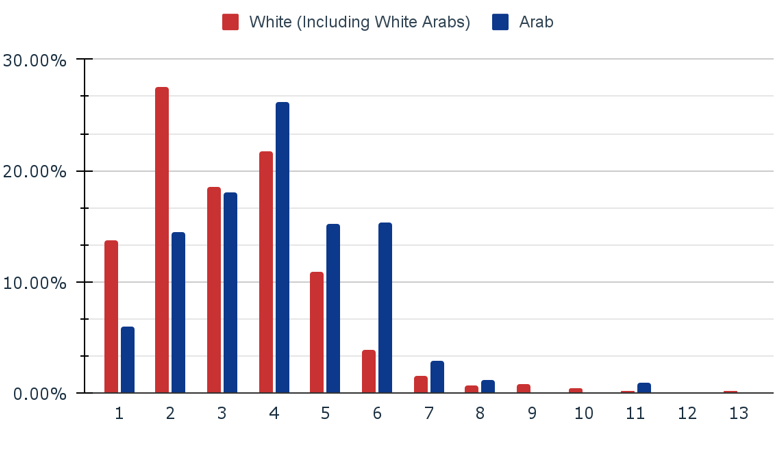
Source: ACS 2020 1-year Microdata with R/ECON Calculations
Citizenship and Ability to Speak English
Citizenship yields certain privileges, and the process of gaining citizenship can be time-consuming, expensive, and isolating. A rather large share of New Jersey’s Arab population (21.3%) is not able to identify as a U.S. citizen; 45.2% of White Arab New Jerseyans have been naturalized; and 6.0% are citizens born abroad or in U.S. territories. That is, just 27.5% of White Arab New Jerseyans are native-born U.S. citizens. This suggests that most White Arab New Jerseyans are first-generation immigrants. The difference in citizenship portends a lack of access to our nation’s social safety net.
The fact that many Arabs might pass as White might make some believe that prejudice is not a concern; however, the ability or inability to speak English fluently with no or little accent can affect job outcomes. In fact, the vast majority of White Arabs in New Jersey (76.2 percent) speak Arabic at home. And while a surprisingly large share of the White Arab population (83.51 percent) speaks English at home, 13.3 percent of the population claims less-than-perfect English, a source of potential prejudice among other members of New Jersey society (see Figure 3).
Figure 3: Self-reported Ability of White Arab New Jerseyans to Speak English, 2020
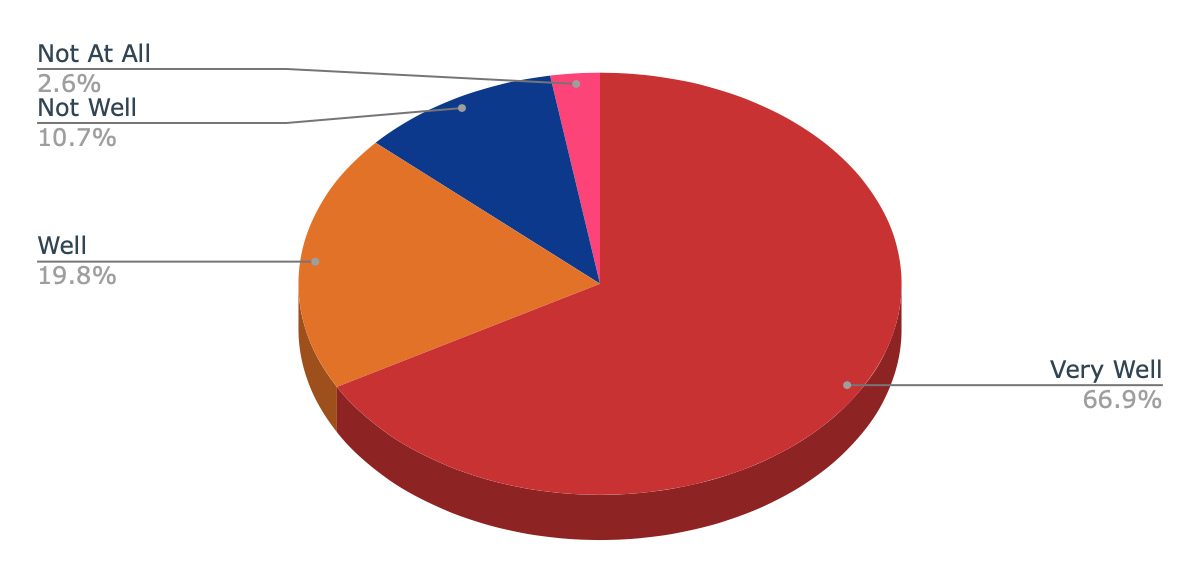
Source: ACS 2020 1-year Microdata with R/ECON Calculations
Healthcare Insurance
Access to healthcare, as well as the type of healthcare is crucial to understanding the differences between New Jersey populations. Of the White New Jersey population, 78.9 percent have private health insurance. Of the Arab New Jersey population, only 53.8 percent have private health insurance. About 32.6 percent of New Jersey’s White population has public health insurance, while 44.0 percent of the state’s Arab population has it. Importantly, public health insurance is given based on income, in an attempt to make healthcare more accessible to lower-income individuals. Notably, White Arab New Jerseyans (9.53%) are also more likely than White New Jerseyans (4.22%) to be uninsured. These different healthcare insurance outcomes underline the importance of easier distinction by policymakers.
Conclusions
The findings of this analysis supplement the idea that a Middle East/North African (MENA) category in the Census (distinct from the White category) would be beneficial for distinguishing the lived experiences and needs of many Arab New Jerseyans.
References:
[i] “White” MENA countries not explicitly identified in the ACS are Bahrain, Oman, and Qatar.
[ii] Ancestry was used only for Palestine because of the Palestinian refugee crisis. Similarly, Palestinians born in Palestine will likely have an Israeli label as a place of birth. This would complicate our work since it focuses strictly on the Arab community.
[iii] The 2020 1-Year ACS Data show New Jersey had 8,866,396 inhabitants.