
Michael Lahr, R/Econ™
In terms of both crude oil and natural gas production, Russia is second only to the United States worldwide. Moreover, about 8% of U.S. petroleum imports are from Russia.[1] For Europe, that share is closer to 40%.[2] So, clearly the Russia-Ukraine crisis poses a severe risk to petroleum markets. The shutdown of all westward flows of petroleum products from Russia will force remaining global supplies to tighten. The highest bidders will secure the remaining allocations of the reduced pools of both crude oil and natural gas. That is, as petroleum supplies tighten, fuel prices will rise.
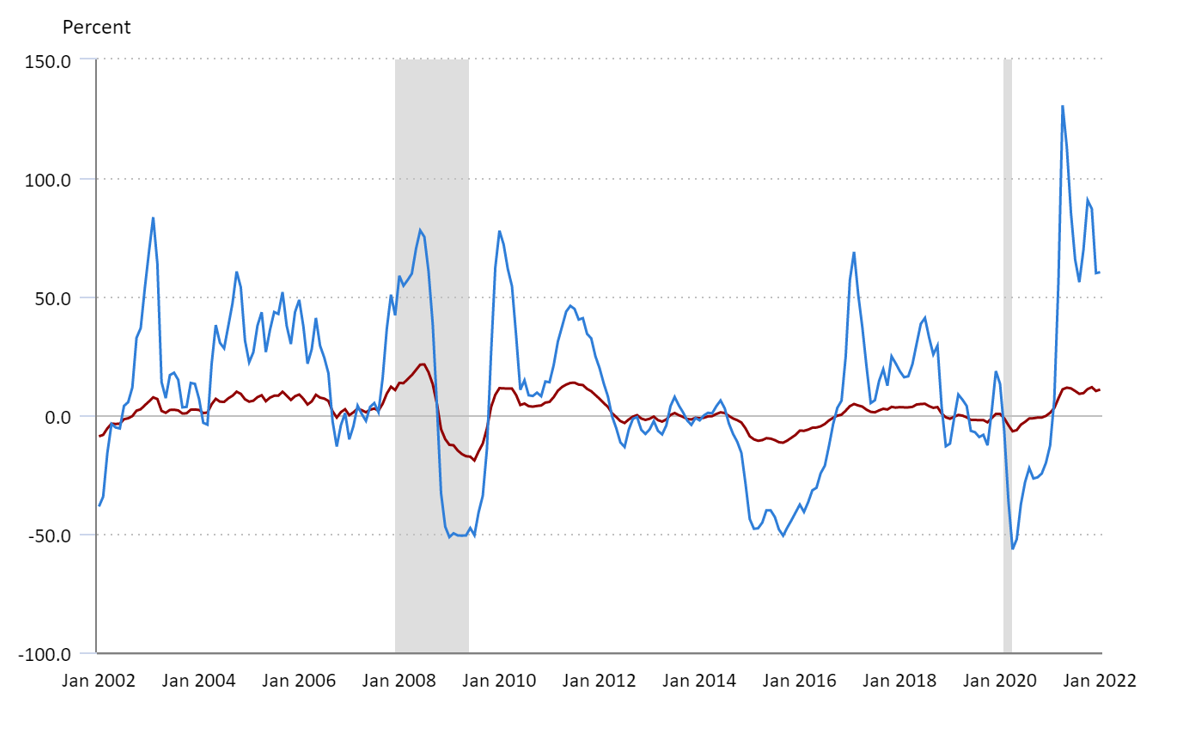
This rough news arises just as we started to enjoy some easing of petroleum import prices that skyrocketed unexpectedly from February through May 2021 (see Figure 1 for a national picture). While households tend to spend less than 5% of their incomes on energy products (e.g., electricity, natural gas, heating oil, gasoline, diesel fuel and motor oil), energy prices vary substantially over time and space. Householders are somewhat pre-occupied with energy costs despite their low share of overall consumer spending since commuters observe the vicissitudes of gasoline daily. Additionally, energy is used in the production of all services and commodities. Thus, a rise in energy prices causes rises in prices of other goods and services, particularly those that rely on petroleum products, like transportation services (especially airlines) and the manufacture of glass, aluminum, and petrochemicals.
Figure 1: Price Indices for All U.S. Imports and for Fuel Imports, 12-month percentage change, January 2002-January 2022
![]()
Source: U.S. Bureau of Labor Statistics (2022) “U.S. import and export price indexes, 12-month-percent change,” March 4, available in March 2022 at https://www.bls.gov/charts/import-export/us-import-and-export-price-indexes-12-month-percent-change.htm#
To summarize, because of Russia’s invasion of Ukraine, we should expect substantially more inflation over the next year in the form of energy prices. J.P Morgan analysts suggest that prices of crude oil could rise as much as 50% above present levels.[3] This is on top of the near 50% rise New Jerseyans (and most U.S. households) experienced at the pump over the past year. Most, if not all, of this rise would be felt by consumers at the pump.
As mentioned in a November 2021 R/Econ™ brief, the other prime source of inflation has been vehicle purchases. This source is generated by supply chain issues centered on a shortage of semiconductor chips, a shortage anticipated prior to the pandemic. Apparently, the issues arose so suddenly because auto manufacturers canceled semiconductor orders in the early stages of the pandemic. As the world economy reinvigorated, vehicle producers found chip suppliers had diverted production to electronic goods producers and had also opted to cancel capacity expansion plans. The resulting shortage forced automakers worldwide to stop or limit the production of new cars, trucks, and SUVs. On January 25th, the U.S. Commerce Department reported that median inventory for semiconductor chips had fallen to just a 5 days’ supply, compared to 40 days before the pandemic.[4] In June 2021, House lawmakers passed the U.S. Innovation and Competition Act that focuses on technology development with the hope it will nudge firms (via $52 billion in emergency subsidies) to invest in domestic facilities, particularly with respect to semiconductors.[5] This is a medium-term solution, as it takes an abnormally large amount of funds and time to get such plants into operation mode. That is, it will be at least two years before the Act bears fruit. So, domestic carmakers do not anticipate relief from the supply-chain bottleneck before the summer of 2023. This means we should expect that both new and, especially, used vehicle prices will remain high for the foreseeable future.
Meanwhile, prices of other goods and services have risen recently in New Jersey.[6] Besides those driven by energy and vehicle prices (like freight costs), foods have been a major source of inflation, rising by an average of about 6.0% over the past 12 months ending January 2022; in particular, meats, poultry, fish, and egg prices rose by 14.5% across the state over the past year. Fortunately, prices of other nondurable goods have been flatter. Prices of durable goods have risen a bit more steeply, however. For example, prices of household furnishings have risen 7.7%.
Note that housing costs are not mentioned above, despite double-digit increases in prices reported across New Jersey for existing single-family homes. In fact, the U.S. Bureau of Labor Statistics (BLS) reports that shelter costs of primary residences have only risen by 0.74% over the 12 months from January 2021 to January 2022. This is because BLS measures shelter costs using rent levels rather than home prices. Further, as shelter costs comprise the largest share of households’ expenses it weighs heavily in most inflation indicators, including that favored by the U.S. Federal Reserve system.[7]
Over the past 12 months, prices of consumer goods in New Jersey, as weighed by purchased amounts, have risen by an average of 4.8%. This is steep, indeed, as a year ago we were expecting to encounter inflation rates more like 2.5%, after experiencing a decade of inflation rates below 2.0%.
Last November it seemed likely that we would be rid of high rates of inflation by mid-year 2022 since prices of both key components—vehicles and energy prices—would level off or perhaps even drop. This is because consumer price indices typically measure just the preceding 12 months; so, the period of measurement would no longer include the major price bumps for energy or vehicles. Unfortunately, that no longer seems to be the case. The “good news” is that there is a lot of uncertainty in how the prices of vehicles and energy commodities will pan out. Keep your fingers crossed!
References
[1] Eaton, Colin. (2022) “Why Does the U.S. Buy Russian Oil?,” The Wall Street Journal, March 4. Available online in March 2022 at https://www.wsj.com/articles/why-does-the-u-s-still-buy-russian-oil-11646151935
[2] Jayanti, Suriya. (2022) “The Vital Missing Link in the U.S. Sanctions Against Russia,” Time, February 26. Available online in March 2022 at https://time.com/6151766/u-s-sanctions-against-russia-gas-oil/
[3] Kelly, David. (2022) “The Financial Backdrop as Ukraine Waits and Worries,” J.P. Morgan Asset Management, February 22. Available online in March 2022 at https://am.jpmorgan.com/us/en/asset-management/adv/insights/market-insights/market-updates/notes-on-the-week-ahead/#
[4] U.S. Department of Commerce. (2022) “Results from Semiconductor Supply Chain Request for Information,” January 25. Available online in March 2022 at https://www.commerce.gov/news/blog/2022/01/results-semiconductor-supply-chain-request-information
[5] Ibid.
[6] The price changes reported in this paragraph are population weighted averages of the Consumer Price Indices for Philadelphia-Camden-Wilmington, PA-NJ-DE-MD and for New York-Newark-Jersey City, NY-NJ-PA produced by the U.S. Bureau of Labor Statistics for January 2022.
[7] Mauldin, William. (2013) “What Constitutes ‘Shelter’ in Inflation Measure?,” The Wall Street Journal, May 16. Available online in March 2022 at https://www.wsj.com/articles/BL-REB-18961