By Angie Nga Le
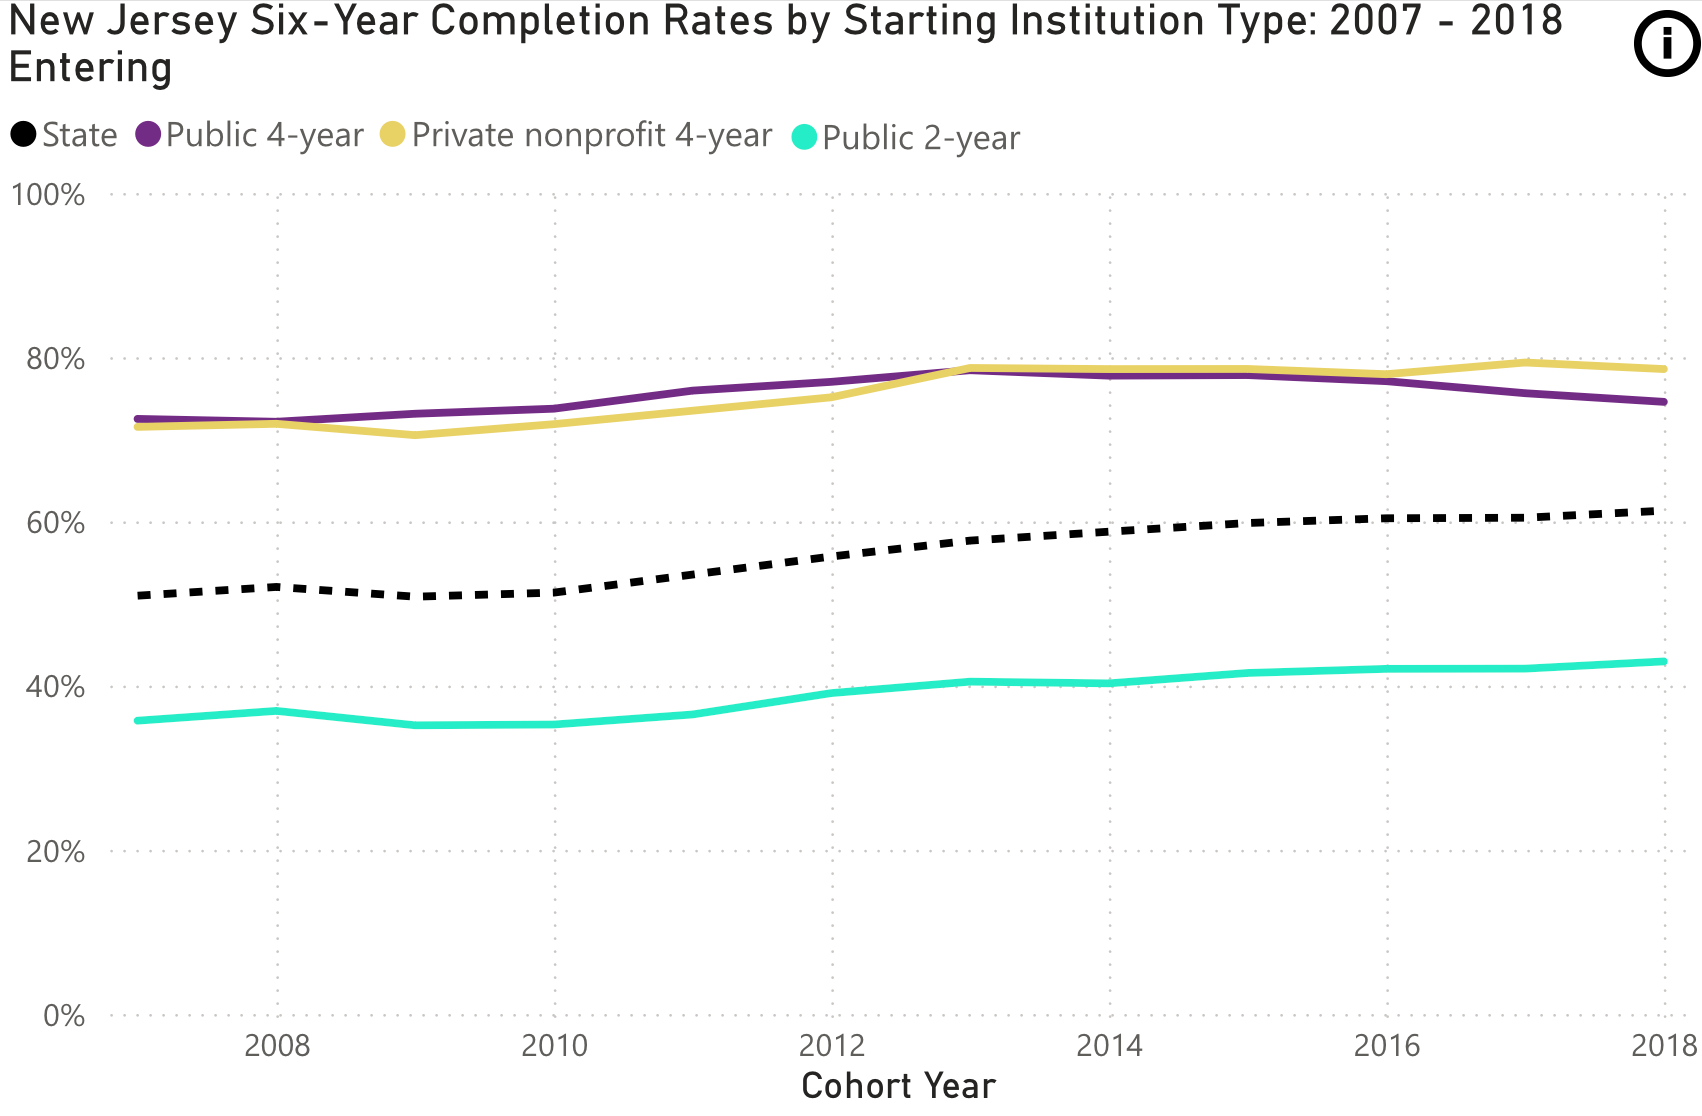
In December 2024, the National Student Clearinghouse Research Center released a report on credential attainment among college students nationwide[1]. The six-year completion rate in New Jersey continued its upward trajectory, with the 2018 cohort achieving a completion rate of 61%, representing a 0.9 percentage point gain from the previous cohort (Figure 1). This outcome mirrors the national trend. The national six-year completion rate also peaked for the 2018 cohort at 61%, representing a 0.5 percentage point increase over the 2017 cohort.
Among all U.S. states, New Jersey ranks 25th in the six-year completion rate for the 2018 cohort. The District of Columbia and Rhode Island reported the highest rates, 82% and 72%, respectively. For most states, this rate showed little change compared to the previous cohort. Only ten states experienced a greater increase in completion rate than New Jersey, with a rise of one percentage point or more[2].
Students in community colleges were the main driver in improving the six-year completion rate for the 2018 cohort in New Jersey. Their completion rate was 43%, a rise of 0.9 percentage points compared to the previous cohort. In contrast, in all other reported institutions, including public four-year and private nonprofit four-year universities, six-year completion rates for fall 2018 starters declined, with decreases of 1.1 and 0.8 percentage points, respectively.
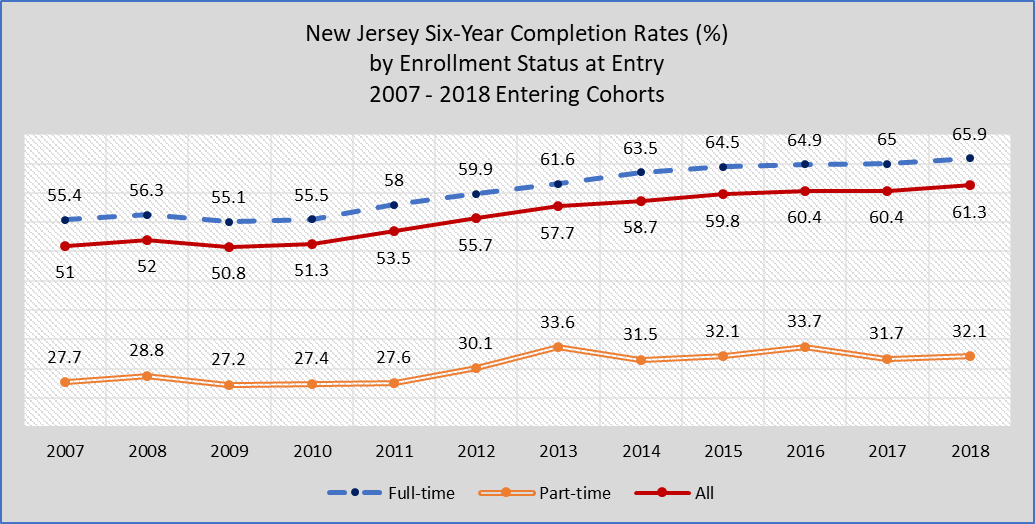
The completion rate by the sixth year for students who started full-time was much higher than for part-time students (Figure 2). Nearly 66% of full-time starters in 2018 received their credentials, compared to about 32% of their part-time counterparts, although both groups improved compared to the 2017 cohort. At the same time, prior dual enrollment experience appears to help students complete their credentials. The six-year completion rate for first-time college students who started in 2018 and had previously taken dual enrollment courses was 72%, compared to 59% for those who had not taken college-level courses during high school.
Among different age groups in the 2018 cohort, students aged 20 or younger had the highest six-year completion rate at 64%. This group was also the only one to experience an increase in completion rate, rising by 0.8 percentage points compared to the previous cohort. In contrast, older students had lower completion rates. Specifically, students aged 21 to 24 had a completion rate of 34%, a decline of 0.9 percentage points from the previous cohort. Meanwhile, students aged 25 or older had a completion rate of 30%, the same as the previous cohort.
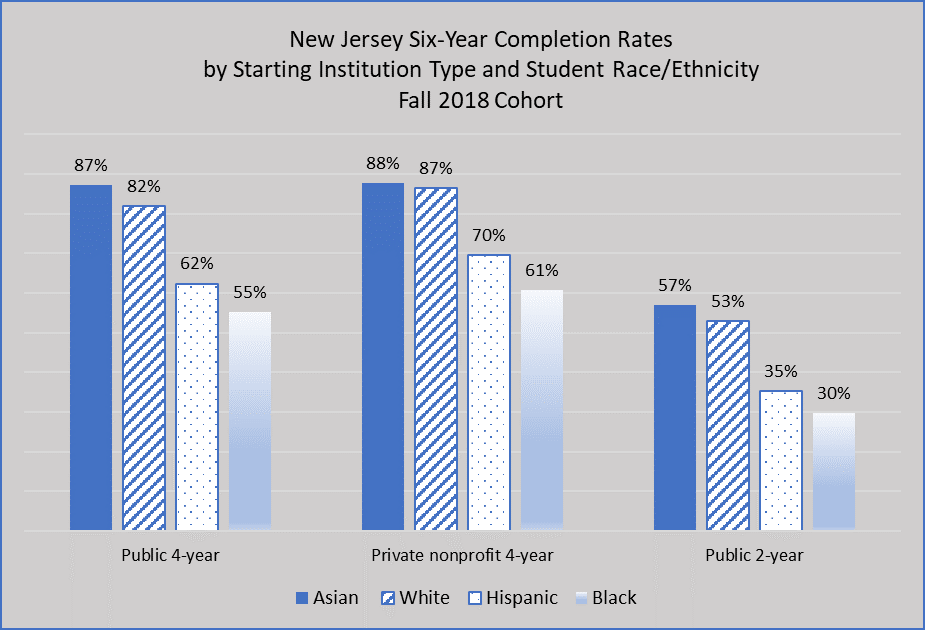
Asian students in the 2018 cohort achieved the highest six-year completion rates across all institution types, followed closely by White students, while smaller proportions of Hispanic and Black students completed their studies during the same timeframe (Figure 3). Hispanic and Black students were most likely to complete their programs of study at private nonprofit four-year institutions (70% and 61%, respectively), and least likely to complete at public two-year colleges (35% and 30%, respectively).
Figure 1.

Source: National Student Clearinghouse Research Center. (2024). Yearly Progress and Completion. https://nscresearchcenter.org/yearly-progress-and-completion/
Figure 2.

Note: Data are collected by the National Student Clearinghouse Research Center. (2024). Yearly Progress and Completion. https://nscresearchcenter.org/yearly-progress-and-completion/
Figure 3.

Note: Data are collected by the National Student Clearinghouse Research Center. (2024). Yearly Progress and Completion. https://nscresearchcenter.org/yearly-progress-and-completion/
Angie Nga Le is a postdoctoral associate at the New Jersey State Policy Lab.
References:
[1] National Student Clearinghouse Research Center. (2024). Yearly Progress and Completion. https://nscresearchcenter.org/yearly-progress-and-completion/ The study analyzes annual data on progress and completion outcomes of first-time, undergraduate students who enrolled in postsecondary education between fall 2007 and fall 2018. It provides historical trends in six- and eight-year college completion rates nationally and by state. The reported completion rate accounts for all students who entered postsecondary education for the first time each fall during the studied period, whether they enrolled full-time or part-time at two-year or four-year institutions. This includes students who completed their programs at their starting institutions as well as those who completed their studies after transferring.
[2] The ten states are Arizona, Hawaii, Kentucky, Mississippi, North Carolina, South Carolina, South Dakota, Utah, Virginia, and West Virginia. The increases ranged from 2.9 percentage points (Utah) to 1 percentage point (Virginia).

