

By Vandeen Campbell
High schools’ focus on STEM is a key feature of the ongoing study of the relationship between science course sequences, college enrollment, and pursuit of STEM fields for students in New Jersey. Alongside the question of what types of science course sequences are predictive of positive student outcomes, studying the role of high school STEM focus will give further insight into the question of what high school policies can be important for improving STEM participation.
STEM-focused high schools have primarily been identified as schools which have a declared STEM theme, usually with the implementation of a particular STEM program or STEM-centered policy. STEM-focused high schools are often specialized or magnet schools, though not always. They typically offer some combination of advanced coursework, opportunities for students to engage in real-world problem-solving, and partnerships with universities, research institutions, and industry professionals, allowing students to gain exposure to cutting-edge research and industry practices. The curriculum may also include interdisciplinary projects, competitions, and internships to foster critical thinking, collaboration, and creativity. Attending a STEM-focused school has been shown to increase STEM identity and persistence.
One proposition in this study is that many other schools could also be considered STEM-focused, at least to an extent, and a proxy measure, which can be constructed from readily available data, can be useful for studying the role of a STEM orientation in schools in predicting later student outcomes. For example, the study’s hypothesis is that when a school offers greater proportions of advanced curricula in STEM subjects and enrolls greater proportions of students, it is likely that the school holds STEM participation as a priority, and therefore could be deemed “STEM-focused.”
Proxy measures of high school STEM-focus were constructed to indicate the level of prioritization of STEM curricular opportunities at high schools in New Jersey. One measure is a composite based on the proportion of the AP science, math, and computer science curricula offered in 2016-2017 and 2017-2018, which correspond with the 9th grade year of the cohorts of focus in the study. The scale is highly reliable with an alpha of 0.95. The box plots in the two figures below give an idea of the distribution of high school STEM focus based on this composite measure, segmented by counties in NJ and level of school segregation (as described in previous reporting).
Median high school STEM focus for 12 of the 21 counties (or 57% of counties) is at or above the mean across all schools. The spans of the ‘whiskers’ for most of the boxes show great variability within counties. By school segregation measures, a familiar pattern emerges where the median STEM focus in high schools segregated racially, racially and economically, and, to a lesser extent, those segregated economically alone are well below the average across all schools. For schools segregated by race or both race and poverty, the median STEM focus is more than a standard deviation below the mean scale score. In sum, there is great variability in STEM focus in NJ when relying on this more general definition of STEM focus. Notwithstanding this greater variability, STEM focus is considerably less prevalent in segregated schools.
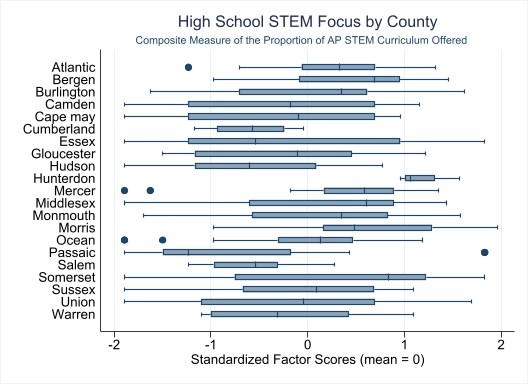
Source: Author’s calculations based on data from NJ Department of Education School Performance Reports, 2016-2017, 2017-2018. How to read the box plots: A total of 339 of 376 high schools had available data. Each box shows the distribution of STEM focus for the labeled county. The line inside the box indicates the median factor score. The lower hinge of the box is the 25th percentile and the upper hinge is the 75th percentile. The bottommost and topmost end of the ‘whiskers’ on each box show the lower and upper bounds of the range, respectively. The dots represent schools that are far outside the range for that group (i.e., outliers).
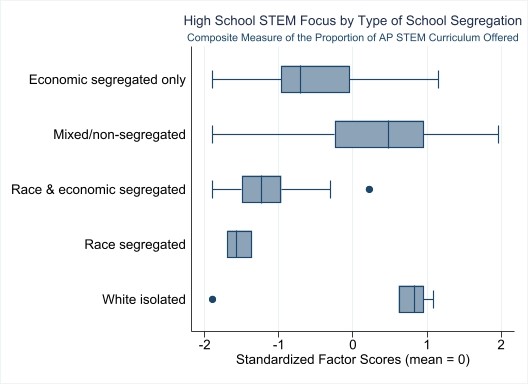
Source: Author’s calculations based on data from NJ Department of Education School Performance Reports, 2016-2017, 2017-2018. How to read the box plots: A total of 339 of 376 high schools had available data. Each box shows the distribution of STEM focus for the labeled category of school segregation. The line inside the box indicates the median factor score. The lower hinge of the box is the 25th percentile and the upper hinge is the 75th percentile. The bottommost and topmost end of the ‘whiskers’ on each box show the lower and upper bounds of the range, respectively. Only 7 schools are in the ‘White isolated’ category and only 3 schools are in the race segregated category. Thirty-nine (39) schools are economically segregated alone. The majority (243) are in the mixed/non-segregated category, but a substantial number (47) is in the race and economically segregated category. The dots represent schools that are far outside the range for that group (i.e., outliers).