
Source: U.S. Census Bureau.
https://www2.census.gov/programs-surveys/popest/datasets/2020-2023/state/totals/NST-EST2023-ALLDATA.csv
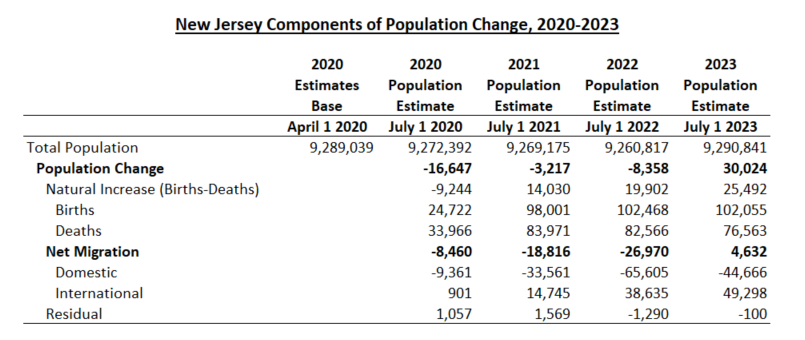
The U.S. Census Bureau’s annual state population estimates released this month show New Jersey resuming population growth after experiencing a decline of nearly 30,000 residents since the 2020 Decennial Census. The increase of just over 30,000 residents (0.3%) in 2023 as of the Bureau’s July 1 estimate brings state population to slightly above the April 1 2020 decennial base, and exceeds the most recent R/ECON state population growth forecast of 15,800 in 2023 by almost double.
As shown in the table above, the Census Bureau calculates population change as the sum of the natural population increase (births minus deaths) and net migration (net international migration plus net domestic migration).[1] New Jersey’s recovering population growth this year has been driven by both a growing natural increase and a shift to positive net migration.
The number of births in the state was about the same in 2023 as in the prior year, while the number of deaths dropped by 6,000, as the impacts of the COVID-19 pandemic eased further. The pattern was similar at the national level, as births dropped by less than 1%, while the number of deaths declined by nearly 9% from the prior year.
New Jersey’s population growth has long been buoyed by significant international in-migration, which has only partially offset high levels of net domestic out-migration. Net domestic migration averaged an outflow of over 53,600 from 2011 to 2019, while international migration averaged just over 32,400 for the same period, resulting in average annual net migration of -21,200.[2] In fact, 2023 marks the first year since at least 2010 in which New Jersey has experienced positive net migration. This is the result of a surge in international migration to its highest level in recent years following the near halt to immigration during the pandemic, coupled with a sharp decline in net domestic out-migration (which nonetheless remains high).
Recovering population growth, with improving net migration and natural increase, is a welcome occurrence, but may be a brief one. Regionally, both New York and Pennsylvania have lost population over the last three years, with New York ranking dead last in population growth among the 50 states and D.C. Nationally, an aging population and declining birthrates point to slower population growth in the medium- to longer-term, and the continued geographic shift in U.S. population continues, with the South growing by over 3% since 2020, while the Northeast has seen its population decline by 1.1%.
Stagnant or declining population can be a significant drag on economic growth and put significant pressure on state finances. As noted last year in a piece from Pew, “Though a smaller population can lead to a reduction in some types of spending, it also means there are fewer residents to help cover the costs of long-standing commitments, such as debt and state employee retirement benefits” (Pew Trusts).
References:
[1] Note that the natural increase and net migration do not sum to the total population change, which represents the difference between total population in each year. This is because the Census Bureau uses “slightly different input data and methodology” in generating demographically detailed population estimates, resulting in differences between the sum of population components and total population. The residual at the bottom of the table represents this difference. (For a more detailed explanation, see, for example, https://www2.census.gov/programs-surveys/popest/technical-documentation/methodology/2020-2021/methods-statement-v2021.pdf).
[2] Based on Vintage 2019 Census Population and Housing Estimates for 2010-2019. (See https://www.census.gov/data/tables/time-series/demo/popest/2010s-state-total.html).